


1. Introduction
In this paper, we study the effect of common ownership in the financial market on the competition in product markets. We adopt a structural model of demand and supply, which is a version of the model proposed by Berry et al. (1995) (BLP hereafter), to overcome the endogeneity problems related to market variables determined in equilibrium. Data on the U.S. airline industry are analyzed. We find that common ownership raised airfare prices, which consequently softened the competition among airline companies in the first quarter of 2009.
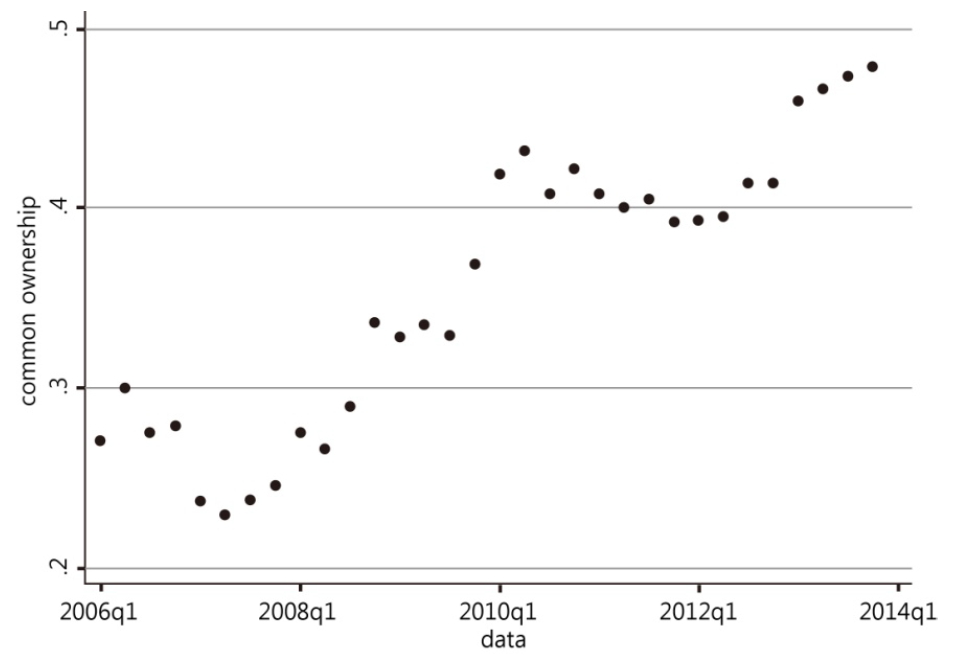
Common ownership refers to overlapping shareholders among companies within the same industry, which may weaken market competition when firms maximize the value of shareholders. For example, suppose investors hold shares of two competing firms. If one firm cuts its price to draw in more demand, the other loses its market share and the average market price decreases. This price competition reduces the other’s profit and its firm value. The total value of the firms is maximized when the two firms act like a monopolist. Accordingly, shareholders with common ownership are more likely to vote against a business strategy that promotes competition among firms, which decreases the corporate incentive to compete. <Figure 1> shows a growing level of common ownership in the U.S. airline industry. The average common ownership has almost doubled from 2006 to 2013. With the recent popularity of passive investments and mergers and acquisitions movements in the asset management industry, the level of common ownership is expected to grow in the future and this growth could have a substantial effect on product market competition.
Studying the effect of common ownership on product markets involves the issue of endogeneity. In the recent empirical research that has spurred the current debate on common ownership, Azar et al. (2018a), MHHI delta is employed as a proxy variable of common ownership concentration. However, this measure depends on both common ownership and market shares, and factors related to market shares are likely to be correlated with unobservables that affect prices. If there is a cost-push factor left in error terms, price increases and market share decreases simultaneously, which in turn changes the MHHI delta. Furthermore, common ownership might be also endogenous in that a change in product prices could alter shareholdings. Therefore, this possible endogeneity problem could bias the estimate of the coefficient on MHHI delta, thereby misrepresenting the relationship between common ownership and product market competition. In this context, some have criticized the regression model of prices on MHHI delta and demanded a more theoretically motivated analysis (e.g., O’Brien and Waehrer, 2017; Backus et al., 2018).
We adopt a structural model approach to address the endogeneity problem by modeling demand and supply. Demand is assumed to follow a discrete-type randomcoefficient nested logit model that has been applied in several studies on the U.S. airline industry (e.g., Berry et al., 2006; Berry and Jia, 2010; Ciliberto and Williams, 2014). In addition, supply is modeled to incorporate the full ownership structure of shareholders and reflect the corporate incentive to coordinate on prices with competitors because of common ownership. From a firm’s profit maximization problem, we derive the terms that mirror the anticompetitive incentive caused by common ownership. Along with demand and cost parameters, we estimate the coefficient of the common ownership terms, which reveals the relationship between common ownership and product market competition. The theory-driven common ownership terms do not depend on market shares, thereby reducing the endogeneity problem caused by the MHHI delta. We use the information on index inclusion to construct an instrumental variable of common ownership and address the remaining endogeneity.
The U.S. airline industry data in the first quarter of 2009 are used for our analysis. We choose the U.S. airline industry to study the effect of common ownership on the competition for the following reasons. First, the industry has gained attention over its possible anticompetitive outcomes. In recent years, the level of common ownership in the industry has almost doubled while there have been a governmental investigation and a class-action lawsuit against major U.S. airlines over price collusion.1) Second, the available industry database provides detailed information on productlevel characteristics and shows large variations across markets, which helps identify parameters. Our sample dataset has 244,253 observations and 5,503 markets. We define a market as a unidirectional trip between two airports.
Our empirical analysis shows that common ownership has softened competition among airline companies in the first quarter of 2009. The coefficient on common ownership is significantly positive, rejecting the null hypothesis that common ownership does not affect a firm’s pricing behavior in product markets. The significantly positive coefficient on common ownership means airline companies are controlled by voting shareholders that care about their interests in other competitors because of commonly held shares. This result implies that airline companies internalize their price effects on others’ profits and coordinate price setting. The degree of internalization and price coordination depends on the pairwise level of common ownership between firms. Firms tend to act more collusively as the common ownership linkage becomes stronger. The estimation results on all other parameters in the structural model of demand and supply are consistent with those of the previous literature on the airline industry Berry et al. (2006), Berry and Jia (2010), Ciliberto and Williams (2014).
Our study contributes to the ongoing discussions on the anticompetitive effect of common ownership. The theoretical literature argues that firms seek to maximize the industry profit and act collusively when shareholders have diversified portfolio (e.g., Rotemberg, 1984; Hansen and Lott, 1996; Azar, 2017). On the empirical side, however, the evidence is diverging. Some studies have found that common ownership leads to more product-market collaborations, such as joint ventures and strategic alliances (He and Huang, 2017) and higher prices (Azar et al., 2018a, 2016) while others have found mixed and economically insignificant (Gramlich and Grundl, 2017) or no evidence (Kennedy et al., 2017). Our model is the closest to Kennedy et al. (2017). However, we reached a different conclusion, which may be due to the differences in the dataset, demand model, and control variables. We construct our dataset by following Berry and Jia (2010) and allow for heterogeneous taste between business travelers and tourists in the demand model, while Kennedy et al. (2017) only use data of largesized markets with at least 2 million population and adopt a simple nested logit demand model.
Our study is also related to the broader literature on the airline industry and collusion. Building upon the BLP structural framework, Berry et al. (2006) and Berry and Jia (2010) develop the empirical model that accounts for discrete types of consumers and estimate jointly the demand and cost parameters in the airline industry. Ciliberto and Williams (2014) extend this structural model by allowing for the number of overlapping markets served with competing firms to affect pricing behavior and find that multi-market contact facilitates tacit collusion in the airline industry. In this paper, we employ common ownership in the BLP structural framework and show that it can be an additional potential facilitator of tacit collusion.
Our study also shares a similar idea with the literature, which suggests that controlling shareholders who own multiple firms can incentivize the commonly-owned firms to act for their benefits even in contradiction to minority shareholder interests. Faccio et al. (2011) and García-Kuhnert et al. (2015) investigate whether large shareholders, who diversify away idiosyncratic risks through diversification demand firms individually to take riskier investments to maximize their portfolio profits. Park et al. (2018) discovered that affiliated firms within a business group make a merger decision in a way that most benefits controlling shareholders across firms.
This paper is organized as follows. Section 2 describes the data, Section 3 presents the model, Section 4 discusses the estimation results, and Section 5 concludes. The Appendix shows the results of the robustness analysis.
2. Data
To examine the effect of common ownership in the financial market on product market competition, we study the U.S. airline industry, which has been gaining growing attention over its common ownership. In its 2015-2017 investigation into fare collusion among the major U.S. airlines, the U.S. Department of Justice (DOJ) has indicated its concerns over the possibility that “airlines have been communicating strategy with each other through their major common shareholders” (McLaughlin and Schlangenstein, 2015b).
We use the data on the shareholdings and airline industry in the first quarter of 2009. As in Berry et al. (2006) and Berry and Jia (2010), a market is defined as a unidirectional pair of an origin and a destination airport, where its size is the geometric mean of the metropolitan statistical area (MSA) population of the end-point cities. Our dataset has 244,253 observations, 5,503 markets, and 16 airlines.2) The data allow for substantial market-level variations to identify demand and cost parameters.
2.1 Airline Industry
We compute market-product level characteristics in the airline industry using the Airline Origin and Destination Survey (DB1B) published by the U.S. Department of Transportation (DOT). The quarterly survey is on a 10 percent sample of airline tickets from the U.S. reporting carriers. Following Berry et al. (2006), we keep round-trip domestic itineraries with at most four flight segments.3) We exclude tickets below $25, above $2500, and with multiple ticketing carriers or a surface sector.4) As discussed in Berry and Jia (2010), records cluster around very similar fares and consumers are unlikely to consider them as differentiated products. Thus, we aggregate the records into a set of progressive fare bins conditioning on the market, ticketing carrier, and nonstop and connecting service.5)
<Table 1> reports the summary statistics of the key variables in our dataset. The product-market specific average airfare price is around $423, the average number of connections is 1.22, and the average distance flown is about 2,833 miles. The sample carriers serve, on average, about 50 different routes at originating airports, and use their hub airports when flying between end-cities of markets in over 50% of travels.6) The average number of products and carriers are about 44 and 4 across markets. The average proportion of low-cost carriers (LCC) and itineraries with nonstop service is 19 and 32 percent, respectively. These figures are in the levels similar to those in Berry and Jia (2010), whose data construction method we follow closely.
2.2 Common Ownership
We construct the common ownership links among the airlines using institutional holdings data from the Thomson Reuters database of the U.S. Securities and Exchange Commission (SEC) 13F filings.7) The data are quarterly and provide information on the U.S. equity holdings of institutional managers with at least $100 million in equity assets under management. We complement it with non-institutional holdings data provided by Azar et al. (2018a), which were hand-collected from proxy statements in the SEC website for owners that hold at least 5% of outstanding shares.
<Table 2> lists the six largest shareholders plus BlackRock and their ownership percentages of outstanding shares as of the first quarter of 2009 for publicly traded airline companies in our sample. The airline companies are owned partly by the same institutional investors. At the end of 2009, BlackRock acquired Barclays’s fund management business (BGI) and the patterns in shareholdings became more concentrated. This increasing trend in common ownership would continue because asset management companies are seeking for more market power amid the shift in demand towards cheaper passive index funds, and hence the number of mergers and acquisitions in the asset management industry are expected to grow (Moody’s, 2018).
MHHI delta is often used as a proxy variable of common ownership concentration in a reduced-form analysis; however, it lacks the theoretical background and causes an endogeneity problem. The MHHI delta is the part decomposed from the modified Herfindahl-Hirschman (MHHI) originated by Bresnahan and Salop (1986) and developed by O’brien and Salop (1999):
where s is the market share, γ is the control weight, and β is the total number of shares. The subscripts i, j and k index shareholder i, firm j, and firm k, respectively. Azar et al. (2018a) use this measure and analyze the anticompetitive effect of common ownership by regressing airfare prices on it. O’Brien and Waehrer (2017) criticize that the MHHI delta and state that it can bias the coefficient on common ownership because of its dependency on market share and the regression model is not well motivated by theory. Specifically, unobserved price factors can affect both prices and market shares, which results in a change in MHHI delta and accordingly an endogeneity problem.
In our analysis, instead of the MHHI delta, we use a term that is theoretically driven in the Bertrand-Nash pricing game and represents directly the anticompetitive incentive of shareholders with common ownership. Similar to O’Brien and Waehrer (2017) and Kennedy et al. (2017), we name the term “common ownership incentive” and define the common ownership incentive of firm j with respect to firm k as
The common ownership incentive term does not depend on market shares, thereby mitigating the endogeneity problem. It also allows for pairwise variations across firms, which enables analysis at a more detailed level than the market level. Further details on the derivation are discussed in Section 3.2. <Table 3> presents the pairwise common ownership incentives as of the first quarter of 2009.8) The incentive is bigger when voting shareholders possess a larger number of ownership shares in competing firms.
3. Model
We consider an oligopoly model where firms offer a set of differentiated products and compete on prices and allow common ownership across the firms to be taken into account in profit maximization. This structural framework is in the spirit of BLP, and the demand model is a discrete-type random-coefficient nested logit model that has been applied in a number of recent empirical studies on the U.S. airline industry Berry et al. (2006), Berry and Jia (2010), Ciliberto and Williams (2014). The supply model is modified to reflect the incentive to coordinate on prices with competitors due to common ownership. A similar setup for the ownership structure matrix has been used previously in Ciliberto and Williams (2014), Miller and Weinberg (2017), and Kennedy et al. (2017).
3.1 Demand
We assume a nested logit model for a consumer’s choice behavior. We also assume heterogeneous consumers, where there are κr proportions of type r consumers. For a product of firm j in market t, the utility of consumer h of type r is given by
where xjt is a vector of observed product characteristics, pjt is the price, (βr, αr) are the type r consumer-specific taste parameters, ξjt are unobserved product characteristics, vht is a nested logit random taste constant across inside goods, λ is the nested logit parameter, and εhjt is an independently and identically distributed logit error. Two nests exist: one is for air-travel inside goods and the other is for the outside option of not buying any of the inside goods. The nested logit parameter, λ ∈[0, 1], governs substitution patterns between the two nests. The mean utility of the outside option is normalized to zero.
The proportion of type r consumers who choose to purchase a product from the air-travel nest is known to be
where D r t = ∑ j e ( x j t β r - α r P j t + ξ j t ) / λ
Then, the market share of product j in market t is
3.2 Pricing and Marginal Cost
As in Azar et al. (2018a) and Kennedy et al. (2017), suppose a market is comprised of N firms owned by M shareholders. Each firm chooses its price to maximize the portfolio profits of the shareholders weighted by their control power.9) If a voting share guarantees an equal amount of control power, the profit maximization problem of firm j is
where pj is the product price of firm j, γij is the number of shares of firm j with voting power exercised by shareholder i, and πi is the portfolio profit of shareholder i. This can be rewritten as
where βij is the total number of shares of firm j accruing to shareholder i, and Sj(p) and mcj are the market share and marginal cost of firm j, respectively. The subscript k indexes firm k. The common ownership incentive in (8), ∑ i γ i j β i k ∑ i γ i j β i j
For our empirical analysis, we consider the following problem of firm j in which the “coordination weight” that a firm places upon its competitor is a function of the common ownership incentive:
where cjk denotes the common ownership incentive, which is equal to ∑ i γ i j β i k ∑ i γ i j β i j
The Bertrand-Nash pricing assumption generates the following optimality condition:
The optimality condition implies a markup equation given by
The markup of firm j is not only determined by the own-price elasticity of demand but also by the degree of price coordination and the cross-price elasticity of demand. The last term of (11) is the additional markup attainable through coordination with other commonly owned firms. The size of additional markup gets bigger when firms care more about common ownership of voting shareholders in their pricing and the cross-price elasticity of demand with respect to the commonly owned firms is larger. If a firm sells a set of multiple products, the right-hand side of (11) includes another markup term achievable by the internalization of price effects on the other products within the same set.
Following BLP, we specify the marginal cost function as
where wjt is a vector of observed cost shifters, φ is a vector of cost parameters, and ωjt is an unobserved cost shock.
Equations (11) and (12) imply that the cost-side unobservable is
where bjt is the model-implied markup.
3.3 Estimation
In the demand model, we consider two types of consumers: tourists and business travelers. The demand for flight itineraries are affected by the following set of observed product characteristics: airfare prices (Fare), number of connections (Connection), number of markets served by airlines at originating airports (Market Coverage), and distance flown (Distance). Unobservable attributes that influence a consumer’s choice also exist, such as airline reputation and tourist places, which are partly controlled by the tour dummies for markets that cover Florida and Las Vegas (Tour) and carrier dummies. Among these variables, we consider three type-specific demand coefficients on Fare, Connection, and a constant.
In the supply model, we assume that marginal costs differ depending on airplane size following Berry and Jia (2010). Airplane size is proxied by the route-level distance: the small- and medium-sized airplanes for markets shorter than 1,500 miles and the large-sized airplanes for markets longer than 1,500 miles. We consider the following set of cost shifters: Connection, Distance, and a constant. The availability of hub airports (Hub) also affects costs, and we include it in the empirical model.
Given the set of prices and observed product characteristics and conditional on parameters, we first invert (6) and solve for the vector of demand unobservables ξ using the contraction mapping algorithm introduced in Berry et al. (2006), which is a modified version of Berry et al. (1995). For each candidate of demand parameters θd, we evaluate the following equation until ξT converges to ξ and therefore the modelimplied market shares S(x, p, ξ; θd) are equal to the actual observed market shares s. The iteration is expressed as
where T denotes the Tth iteration. Then, the demand unobservable is a nonlinear function of the product characteristics, prices, observed market shares, and parameters:
Next, we estimate the demand and cost parameters jointly by minimizing
where W is a weighting matrix, and G(θd,θs) is the stacked set of the sample analogs of the population moments, (gd, gs). The population moments are the orthogonality conditions between structural errors and instruments z : g d = E [ ξ j t ( x , p , S ; θ d ) | z j t d ] = 0 g s = E [ ω j t ( x , p , S ; θ d , θ S ) | z j t S ] = 0
The functional form of the coordination weight that we use in the estimation is
which is a linear function of the common ownership incentive similar to Kennedy et al. (2017). If the common ownership coefficient ϕ equals to 0, we assume that the effect of common ownership on product market competition does not exist. Whereas, if ϕ is set to 1, we assume that firms take into account the common ownership incentive fully in their price setting as implied in the model under the assumption that one vote has one unit of control power. In the main model specification, we allow ϕ to be flexible between -1 and 1 to consider the intermediate case of no effect and additionally full effect. We also allow ϕ to be negative to include the possibility that firms place a penalty on common ownership. A significantly positive coefficient on common ownership suggests a corporate decision is affected by common ownership of voting shareholders, which may result in price coordination among commonly owned firms and reduce the degree of product market competition.
Identification requires at least one instrument for endogenous and nonlinear parameters that satisfy the orthogonality with respect to structural errors. Prices are likely to be correlated with demand structural errors because firms acknowledge the value of the product characteristics unobserved by econometricians and reflect the value in prices. To deal with this endogeneity problem, we use a set of instruments that affect costs solely such as the hubness of the destination airports, which reduces the marginal cost of a flight by improving fuel efficiency but likely does not influence demand (Berry and Jia, 2010). We also include rival attributes such as the number of rival routes, the number of rival routes with direct flight service, etc. As for the nested logit parameter, we exploit the exogenous variation in the choice probability conditional on the purchase of the air-travel nest. The standard instrument is the number of firms operating in the market. We identify the discrete-type randomcoefficient parameters using the correlation between local demographics (e.g., population) and the exogenous observed product characteristics, which shows a different mix of products and different substitution patterns across markets. The common ownership incentives can be endogenous if the choice of shareholding is correlated with the unobserved cost shifters. Accordingly, we instrument them with the number of airlines with the index inclusion at the market level and use the information on the Russell 1000 following Kennedy et al. (2017). Finally, similar to Berry and Jia (2010), we include the exogenous variables in the share and marginal cost equations and interaction terms between the variables with low collinearity.
4. Results
The structural estimates from different model specifications on common ownership and price coordination are reported in <Table 4>.10) We consider three cases for the common ownership coefficient: (1) ϕ = 0, (2) ϕ =1, (3) |ϕ | ≤ 1.
Column 1 of <Table 4> presents the estimates of the demand and marginal costs when we assume that firms compete as Bertrand-Nash competitors and do not coordinate on prices. In this case, ϕ is restricted to 0 and therefore firms are not influenced by common ownership of voting shares when they are choosing prices. The estimates are all in the expected signs and are largely consistent with previous studies of the airline industry (e.g., Berry et al., 2006; Berry and Jia, 2010; Ciliberto and Williams, 2014). We find that the price coefficients are -0.949 for the first type and -0.067 for the second type. The fraction of the first type (κ) is 0.855. From this result, we can infer that the first type is the tourist type who is very sensitive to prices and takes a larger fraction of the total consumers. The second type is, then, the business-traveler type. The median own-price elasticities of demand11) are -5.136 for the tourist type and -0.362 for the business-traveler type, which makes -3.461 in total. As expected, consumers prefer direct flight services and airlines that serve diverse markets from originating airports. The concave relationship in distance flown shows consumers find air travel more attractive for trips with long distance but this effect diminishes gradually as the outside option of no air travel becomes more attractive. The nested logit parameter (λ) is 0.646, thereby suggesting that substitution patterns occur within the air-travel nest. On the supply side, we find that the marginal cost is increasing in distance, and decreasing in the number of connections and availability of hub airports.
Column 2 of <Table 4> shows the results when we assume that ϕ equals to 1 and the degree of price coordination is determined exactly by the common ownership incentives. As in Ciliberto and Williams (2014), we find that the demand estimates are similar whereas the supply estimates differ from that in Column 1 of <Table 4> in response to a change in the assumed behavioral model. The differences in the estimated coefficients and assumption on the effect of common ownership lead to slightly different estimates of marginal costs and elasticities.
Column 3 of <Table 4> presents the estimates of the main model specification including the coefficient on common ownership incentives and demand and marginal costs. In this case, we allow ϕ to be flexible between -1 and 1 to enable firms to reflect common ownership incentives only partially or even negatively in their pricing behavior. We find that the coefficient on common ownership incentives is significantly positive. The result implies that airline companies are controlled by their voting shareholders and internalize their price effect on the profits of commonly owned companies. Therefore, common ownership in the financial market is likely to have facilitated price coordination and raised airfare prices in the U.S. airline industry in the first quarter of 2009. The magnitude of the estimate is 0.970, which suggests the weights that firms put on other firms in the profit maximization problem are almost equal to the size of common ownership incentives. In the presence of this nonzero coefficient on common ownership incentives, most demand and supply estimates except for the type 1 fraction are slightly lower than the ones in Columns 1 and 2 of <Table 4>. The price coefficients are -0.925 for the tourist type and -0.066 for the business-traveler type with the tourist-type ratio of 0.869, which leads to a median marginal cost of $211.7, the median own-price elasticity of -5.002 for the tourist type and -0.358 for the business-traveler type.
<Table 5> provides the coordination weights conditional on the estimates in <Table 4> and given the common ownership incentives in <Table 3> as of the first quarter of 2009. The weights represent the extent to which a firm internalizes its price effect on the profits of its rivals because of the presence of common ownership. The highest value of the common ownership incentives is 0.884, leading to a coordination weight of 0.858 that American Airlines (AA) places on Southwest Airlines (WN). The result indicates that voting shareholders of AA have large common ownership in WN and have anticompetitive incentives to maximize their aggregate profits, which results in large coordination weight for AA with respect to WN. Among the publicly traded airline companies, the lowest common ownership incentive and corresponding coordination weight are 0.014 for Allegiant Air (G4) with respect to AA.
The results in the main model specification suggest that airline companies linked through higher common ownership are more likely to coordinate to a larger degree in setting airfare prices. In turn, this coordination could channel into prices higher than the competitive levels, which has a negative effect on the market competitiveness. Our finding is largely consistent with Azar et al. (2018a), who show that common ownership increases prices in the U.S. airline industry using the reduced-form regression model, and are related closely to He and Huang (2017), who reveal that common ownership increases corporate profitability using the U.S. industry data including those of airlines. Meanwhile, our finding is in contrast with that of Kennedy et al. (2017), who argue that airline companies do not take into account their shareholders’ common ownership in setting prices using the structural model.12) Although the structural model of Kennedy et al. (2017) is similar to the one we use in this study, two main differences can be observed. First, they select only large-sized markets with at least 2 million population and use a limited dataset in their analysis. Second, they estimate demand with a simple nested logit model and a smaller set of control variables. In contrast, we use data from medium to large areas with at least 0.85 million population following Berry and Jia (2010). Berry and Jia (2010) state that they exclude small markets that exhibit a “drastic difference” in demand patterns. However, the exclusion of medium markets, which account for the majority of the observations, appears to limit the cross-sectional variation and change the estimation result. Further, we allow for heterogeneous taste across different consumer types to obtain more realistic patterns of elasticities, which in turn affects the supplyside cost estimates. We also consider a larger set of observed product characteristics and cost shifters to control for possible confounding factors that might affect the statistical relationship of our interest. These contrasting features led to our conclusion on the anticompetitive effect of common ownership.
5. Conclusion
We find that common ownership softened the competition in the U.S. airline industry. In particular, we adopt a structural model of demand and supply and use an additional instrument for common ownership to overcome the endogeneity problem. We identify the extent to which airlines are controlled by the anti-competitive incentive of voting shareholders and consider common ownership linkage when setting airfare prices. The results suggest airlines with a significant level of common ownership linkage (e.g. American and Southwest) internalize their price effects on the profits of commonly owned firms and coordinate on prices by a larger degree, whereas those with little common connection (e.g., Allegiant and American) do not.
One possible extension of this paper would be a merger analysis that accounts for the effects of common ownership on product markets. Generally, mergers and acquisitions should meet antitrust approval. For example, BlackRock’s acquisition of BGI was allowed after assessments on its anticompetitive effect in the asset management industry (Commission of the European Communities, 2009). However, such a change alters the ownership structure in other product markets that related asset managers hold shares, which in turn could affect the degree of competitiveness in the markets. In such a case, the antitrust merger review process should include assessments on the counterfactual common ownership level and its effects on product market competition.