 |
 |
- Search
| Korean J Financ Stud > Volume 48(5); 2019 > Article |
|
Abstract
요약
Notes
1) The Department of Justice (DOJ) launched an antitrust investigation against the four largest U.S. airlines in July 2015 (McLaughlin and Schlangenstein, 2015a), and at the time multiple consumer lawsuits were filed against them, which have been consolidated into In re: Domestic Airline Travel Ticket Litigation, Case 1:15-mc-01404-CKK. The DOJ’s investigation ended with little evidence on price-fixing by limiting the supply of seats in January 2017 (McLaughlin and Schlangenstein, 2017). Meanwhile, Southwest and American airlines agreed to pay $15 million and $45 million to settle the class action in 2017 and 2018, respectively (U.S. District Court District of Columbia, 2017, 2018).
2) The sample airlines include American (AA), Alaska (AS), JetBlue (B6), Continental (CO), Delta (DL), Frontier (F9), AirTran (FL), Allegiant (G4), Spirit (NK), Northwest (NW), Sun Country (SY), USA3000 (U5), United (UA), US Air (US), Southwest (WN), and Midwest (YX).
3) The International Air Transport Association defines a flight segment as the operation of a flight between the two points where passengers first board and land an aircraft. For example, a round-trip nonstop ticket between LA and NY is comprised of two segments.
5) As in Berry and Jia (2010), we use the following set of fare bins: $20 for tickets under $700 (i.e., tickets above $300 and below $320 with the same itinerary and ticketing carrier are considered to be the same product), $50 for tickets between $700 and $1000, and $100 for tickets above $1000.
6) Following Ciliberto and Williams (2014), the hub airports are Atlanta (DL), Charlotte (US), Chicago O’Hare (AA, UA), Cincinnati (DL), Dallas/Fort Worth (AA), Denver (UA), Detroit (DL), Houston (CO), Minneapolis (DL), Newark (CO), Philadelphia (US), and Phoenix (US).
7) Backus et al. (2019) argue that the Thomson Reuters dataset has gaps in coverage and errors relative to the source documents, the SEC 13F filings. The discrepancy between the Thomson Reuters dataset and the scraped data of Backus et al. (2019) directly from the SEC 13F filings occurs in the period of 2010 and 2015. Since our analysis uses the data from the first quarter of 2009, it is relatively free from this data problem.
8) We calculate the common ownership incentives in <Table 3> given the assumption that a voting share guarantees an equal amount of control power. Thus, we use the number of voting shares as a proxy of the control weight γ in (2).
9) Azar et al. (2018a) adopt a Cournot setting while Kennedy et al. (2017) take a Bertrand setting. Following the previous literature that structurally estimates demand and supply in the U.S. airline industry (e.g., Berry et al., 2006; Berry and Jia, 2010; Ciliberto and Williams, 2014), we assume price competition among airline companies.
10) In Section 4, we discuss the main estimation results using the data of 2009Q1. In the Appendix, we analyze a longer period, 2009Q1 to 2011Q4, and find that the results are consistent with the ones presented in Section 4.
11) The derivative of demand (or market share) with respect to price is computed from (6) and the demand estimates in <Table 4>.
12) Kennedy et al. (2017) find that the coefficient of common ownership is insignificant, which however does not reject the hypothesis that common ownership has a positive effect on prices nor does it provide any evidence on the relationship between common ownership and market competition. A part of their estimation results including the negative effect of distance on marginal costs contradicts economic logic and is inconsistent with previous literature such as Berry and Jia (2010) and Ciliberto and Williams (2014). Azar et al. (2018b) argue that this finding indicates the possibility of inadequate data construction and model misspecification, which might have led to such inconclusive result.
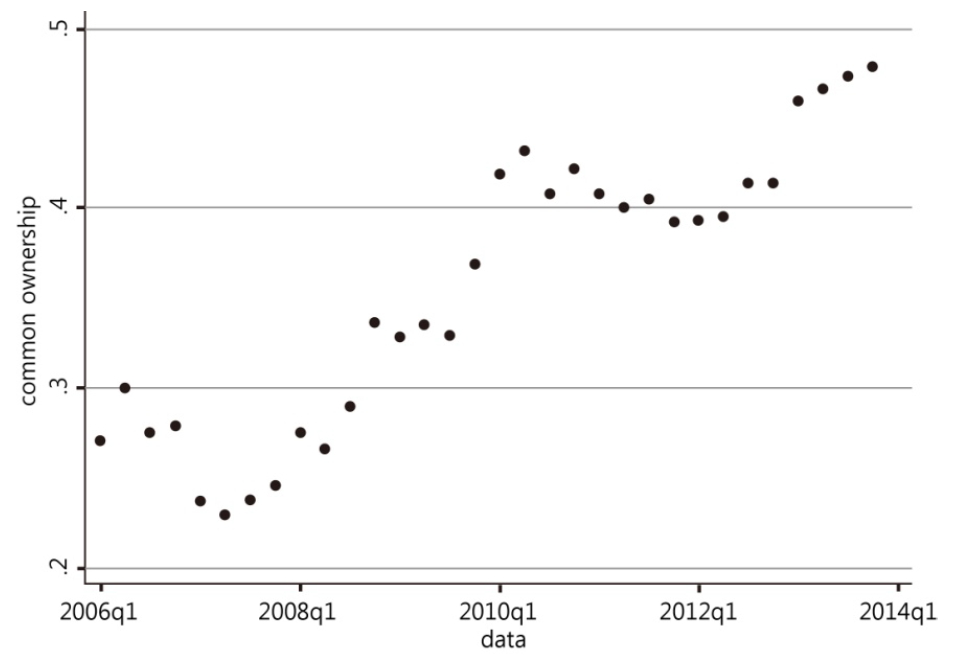
<Figure 1>
Average Common Ownership

<Table 1>
<Table 2>
<Table 3>
<Table 4>
<Table 5>
References
Appendices
<Appendix>
| A. Robustness Analysis |
| We investigate how demand and supply estimates are modified with the changes in the dataset and price aggregation method. Previously, we use one-quarter data and employ a series of progressive fare bins used by Berry and Jia (2010) to differentiate between the market-carrier level tickets. In this section, we use a larger set of data from 2009Q1 to 2011Q4 to exploit the time variation. We also aggregate tickets at the market-carrier level following Azar et al. (2018a) and Ciliberto and Williams (2014), and thus the market-carrier level tickets are treated as the same product. |
| <Table A1> shows that the parameter estimates of demand and supply coefficients are consistent with the main estimation results. In particular, the coefficient on the key variable of our interest, common ownership, is significantly positive with a magnitude of 0.979 at a very similar level to the one estimated previously. The main conclusion on common ownership and its effect on market competition is stable across time and does not depend on a specific method of data aggregation. |
- TOOLS
-
METRICS

-
- 16 Crossref
- 4,280 View
- 127 Download
- Related articles in Korean J Financ Stud
-
Do IOC Orders Improve the Market Quality? Evidence from the KOSPI 200 Futures Market2023 April;52(2)
Do Liquidity Providers Improve Market Quality?: Evidence from the KRX ELW Market2011 ;40(1)


