원유관련 ETP의 투자성과에 관한 연구*
Investment Performance of ETPs Related to Crude Oil*
Article information
Abstract
2020년 초부터 COVID-19로 원유 수요 감소 및 산유국 간 원유가격 분쟁으로 인해 국제유가는 크게 하락하였고 시장 변동성이 확대되었다. 그리하여 원유 관련 상장지수상품(ETP: Exchange-Traded Products)의 손익 및 비용 구조를 이해하지 못한 많은 투자자들이 손실을 경험하였다. 본 연구는 한국에 상장된 원유 관련 ETP의 운용방식 및 비용구조를 조사하고 각 ETP와 서부텍사스중질유(WTI) 시장과의 상관성 및 투자성과를 분석하였다. 또한, 레버리지 ETN의 운용구조와 투자성과를 함께 살펴보았다. 실증분석 결과 원유생산기업 ETF와 WTI 및 선물 ETF 사이에는 통계적으로 유의한 양(+)의 상관관계가 확인되었다. 투자성과와 관련하여 원유생산기업 ETF가 WTI 및 선물 ETF 대비 열위하다는 결과를 도출하였다. 본 연구는 연기금 및 일반투자자의 원유 관련 ETP 손익의 특징을 활용한 투자전략을 제언하고, 정책당국에 관련된 함의를 제시할 수 있다.
Trans Abstract
The unprecedented COVID-19 pandemic at the beginning of 2020 jeopardized the entire world. Meanwhile, the Russia–Saudi Arabia oil war led a crude oil market going out of the frying pan into the fire. This research has two main purposes. First, we investigate structures of the crude oil related exchange-traded products (ETPs) in terms of operation and cost. Second, we analyze the correlation and investment performance of the crude oil related ETPs and West Texas Intermediate spot market. The major findings are as follows: (1) there is a positive correlation between the crude oil spot and the crude oil producing firm, (2) the investment performance of the crude oil related ETPs is inferior to that of the crude oil spot due to the rollover cost, (3) the investment performance of the crude oil related leverage ETNs (Exchange-Traded Notes) or inverse ETPs has deteriorated because their managing structure tracks the daily return which leads to the compounding effects. These empirical results show the characteristics of the gain and loss of the crude oil-related ETPs, which enhance conceptual understanding and offer implications to policymakers and authorities for the efficiency of the alternative investment strategy.
1. Introduction
Crude oil price significantly fell due to collapse in demand caused by the unprecedented COVID-19 outbreak with the Russia–Saudi Arabia oil price war in the early 2020. Benchmark U.S. Crude oil WTI Cushing Spot dived into negative territory on Monday May 11, 2020; the U.S. West Texas Intermediate (WTI) was traded at $25.78 per barrel, a decline of 58% since May 13, 2019, a year ago at $61.04 per barrel. In the first half of 2020, the crude oil prices largely fell and a level of its volatility expanded. These led to an unusual phenomenon that a level of disparity for crude oil related leverage Exchanged-Traded Notes (ETNs) in the Korea Exchange (KRX) was magnified from 100% up to 300%. The investors alleged that crude oil related Exchanged-Traded Products (ETPs) could not trace the price of crude oil spot reasonably due to a rollover cost.
The prices of the WTI crude oil Futures (hereinafter, “WTI Futures”) listed at New York Mercantile Exchange (NYMEX) turned negative for the first time in history on April 20, 2020, reaching -$37.63 per barrel, that is, the WTI Futures for May plunged before its maturity. The oil price war with a lack of storage options and reduction in demand for the commodity under the COVID-19 pandemic contributed to the WTI’s historic price crash, in the meanwhile, the traders appeared to deal with the crude oil futures by paying a higher premium instead of taking over the crude oil spot because of the storage costs. This eventually created phenomenon of distortion in the market.
As the disparity of the crude oil related ETPs (hereinafter, “Crude ETPs”) has been enlarged, the KRX gave heed to investors and activated a single price method as well as trade ban if the disparate ratio expands as displayed in <Table 1>. The Financial Supervisory Service (FSS) issued two warnings against the Crude ETPs, which were the highest level repeatedly. The Financial Services Commission (FSC) on May 18, 2020, unveiled the measures to regulate excessive and overheated investment demand on Crude ETPs.
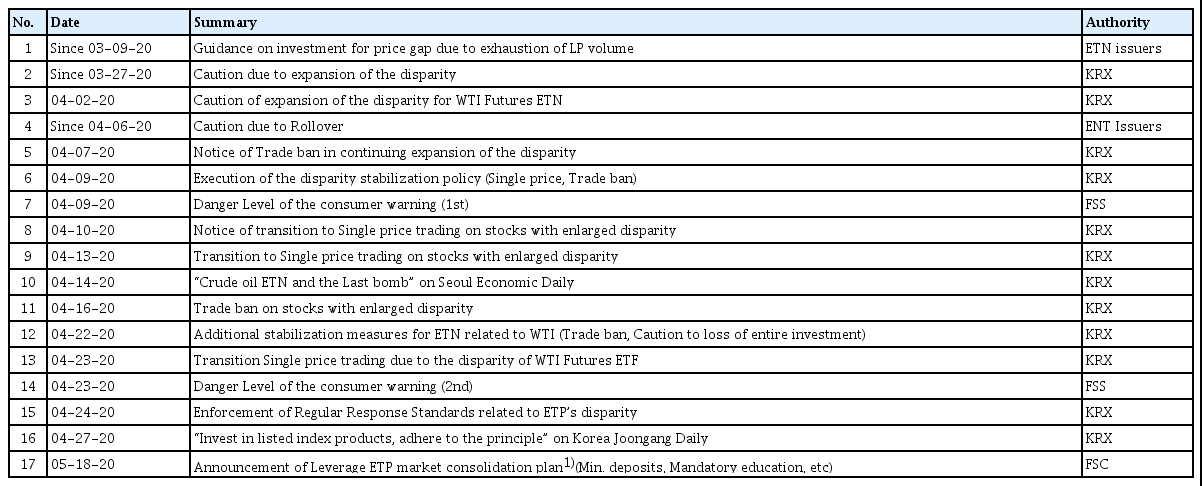
Regulations Related to ETPs to Protect Investors in 2020
As demonstrated in numerous cases related to the Crude ETPs of the first half of 2020, it is feasible that financial products related to the crude oil might not trace the crude oil spot market returns because of investment costs and disparity enlargement. A return of commodity futures is different from that of spot, and the rollover effect for futures possessed also varies types by types (Yoon, 2015). A return of crude oil funds cannot track the crude oil spot prices due to the rollover costs (Baek et al., 2018, 2020) when the funds are based on the futures. Like the preceding, the major detrimental factors on the return of the Crude ETPs are the rollover costs and the disparate ratio (hereinafter, collectively “Investment Expenses”). On account of the rollover costs, the crude oil funds make no claim to follow the crude oil prices effectively, while Russian funds which is positively correlated to the crude oil funds contain dividend incomes without the rollover costs; therefore, the investment in the Russian funds is more efficacious strategy in this context (Baek et al., 2020).
This study researched on variance in returns of the Crude ETPs in comparison with the crude oil spot arisen from the Investment Expenses. A practical use of understanding Investment Expenses of the Crude ETPs is; (1) how effectively they trace the crude oil spot in spite of the Investment Expenses, (2) how efficiently they perform for a certain period of time. The effective investment strategy could be suggested based on the empirical analysis. For investors as well as national pension funds, there must be significant implications whose investment performance and correlation between two financial products, crude oil futures ETPs and crude oil producing company ETP that has no rollover costs.
The remain of the paper is organized as follows: a literature review about relationship between crude oil spot and futures in both the international crude oil market as well as the stock market in Section 2; the data collection and the methodology applied in this study are discussed in Section 3; the relationship among the crude oil spot, the crude oil producing companies ETF (hereinafter, “Crude Company ETF”), the crude oil ETFs (hereinafter, “Crude ETFs”), and the investment performance results of them are analyzed empirically. Furthermore, the comparison among the crude oil spot and the crude oil futures ETFs in line with the crude oil leverage ETNs for the investment performance results is examined in Section 4; being followed by the final conclusion with the implications and proposals.
2. Literature Review
There is no doubt that how much dependent the world economy is on oil and there are many researches done in the past to figure out the correlation between the economy and the oil; it has never been unpopular topics. Jones and Kaul (1996) investigated how the world’s stock markets (the US, Canada, UK, and Japan) react to the oil shocks by the regression analysis. Interestingly, they addressed that the US and Canadian stock markets are rational whereas it was rather impossible to explain the reaction of the UK and Japanese stock markets. Hammoudeh and Li (2005) confirmed that higher oil prices are harmful for the world’s capital market by applying the international APT model. They also added that the markets which are sensitive to the oil are rather integrated with the world’s capital market well.
If demand for a certain product increases over time, according to the law of supply and demand, its price might be predicted to rise at some point in the future. Applying this economic phenomenon to stock and futures market, futures can be seen as a directional signal for spot prices; however, it is necessary to note that price volatility does not always unconditionally follow the laws of supply and demand. In general, a mechanism of change in price is that a today’s event influences tomorrow’s futures prices rather than current spot prices. This is because the futures has more time to reflect new information compared to the spot. Silvapulle and Moosa (1999) conducted the linear and non-linear causality tests in order to analyze the relationship between spot and futures in the crude oil market. They figured out that futures prices can lead spot prices because the futures reflect new information quickly in advance. The new information is not limited to future but could represent past histories and also current records. However, it is dangerous that the futures prices always indicate the direction of the spot prices. Chang and Lee (2015) revealed that the lead-lag relationships between the spot and futures prices are faded out in the long-term, which implies that the higher level of significant causality was found in the pairs of spots and shorter-term futures than that in the pairs of spots and longer-term futures. Its similar research was found also in the study by Polanco-Martínez and Abadie (2016). Their investigation on the relationship between futures and spot prices for various time-scales by employing a nonlinear causality test and a wavelet correlation graphical tool.
Futures can present not only price direction but also market flow. Ozdurak and Ulusoy (2020) applied EGARCH to set up three specifications models to estimate volatility of crude oil and ETF market. ETFs are a consequential source of information dissemination while the causality between futures and spot market for crude oil is bi-directional. In fact, the futures market determined a 75 percent of the information for wheat, corn and orange juice (Garbade and Silber, 1983).
As such, there are often cases of investing in crude oil futures ETPs, which are operated as futures, but if you do not understand exactly what is inside, there could be more harm than good. It is often neglected that investors must rollover to deferred month futures as it approaches maturity of nearby month futures, otherwise, its physical commodities must be acquired (Dulaney et al., 2012). It is also inevitable to encounter the situation of contango and backwardation as the Crude ETPs deal with the spot and futures. The contango is the situation when nearby futures prices are lower than deferred futures prices, which is normal. On the other hand, prices for nearby futures are higher than that for deferred futures; that is called the backwardation. It is noteworthy that contango commonly involves rollover costs, while positive roll returns are associated with backwardation (Peterson, 2015). Moreover, each ETP has different term structures explained in the work of Dulaney et al. (2012). The United State Oil Fund (USO), which is an ETF following 1x US WTI Futures, contracts only nearby month futures and rolls over the entire amount every month. On the other hand, USL, United States 12 Month Oil Fund, invests equally in futures from nearby month to 12th delivery-month. As such, ETP related to crude oil has a diverse investment structure, and there are costs that might be sometimes missed out, e.g., rollover costs and hedge expenses if applicable.
In particular, if futures are prematurely investing in leverage or inverse ETPs for greater return on investment while you are so sure that futures could predict price direction and market flow, the expected losses may be difficult to accept. Liebi (2020) mentioned in the review paper that leverage ETFs were the factor to create volatility spikes in the financial crisis of 2008. In fact, there are even studies demonstrating that leverage or inverse ETP is not suitable for long-term investment. It is losses for the long-term investors of leverage and inverse ETFs, and the only short-term trading is profitable (DiLellio et al., 2014). In addition, Pessina and Whaley (2020) cited prospectuses that long-term expected value of leverage and inverse funds was zero, and concluded that leverage and inverse financial products were not effective investment management tools.
Due to the short history of the commodity market in Korea (Choi et al., 2015), the previous researches are limited. Choi and Yi (2016) conducted the Granger causality test and it concluded that the commodity ETFs are irrelevant to the KOSPI 200 index, whereas they are influenced by the underlying indices. This is supported by Kim and Park (2017), and they revealed that the level of the correlation between the stock market and the commodity market is low; therefore, the underlying assets set the price of the commodity ETFs. Since the first crude future ETF was listed in 2010, the crude oil related ETFs are mostly operated by its futures and the currency hedged financial products (Yoon, 2015). Interestingly, the authors of the previous literatures agreed that the commodity markets are the good alternative investment market with potential; however, they also reiterates to warn the investors because such the commodity ETFs incorporate the mispricing, tracking error, and disparity in between the ETFs and the underlying asset prices could distort the investment performance.
ETPs, a financial instrument referring to both ETFs and ETNs, are clearly one of the important investment products that are growing rapidly (Flores, 2015). Through previous studies, it was rather recommending that it is necessary to understand one’s own investment strategy in terms of long or short-term first, and then invest in appropriate financial products based on accurate understanding of them such as structure, investment method, and costs born. Certainly, there is a lot of opportunities in the oil market with various options (Naeem et al., 2020); however, knowing yourself is the first step to start investment. It clearly manifests, therefore, why this study needs to pursue.
3. Data and Methods
3.1 Data
Basic statistics and correlation between a rate of return of the Crude ETPs and the WTI spot are examined. By comparing Sharpe ratio, it investigates that an investment performance and correlation between the Crude ETPs and the WTI spot. It can find of which the Crude ETPs in terms of the investment performance is superior to the crude oil spot by analyzing the rate of return for the crude oil spot price. The correlation analysis research was conducted based on the sample data collected from open rate of return for each of the Crude ETPs and daily rate of return for the crude oil spot.
Especially, ETF investing in crude oil producing companies, out of crude oil related ETPs listed in the KRX, is sampled to test correlation with the crude oil spot. Funds embarking money in Crude Company ETFs listed in stock market does not bear rollover costs but are exposed to their inherent risks, so this paper inspects the Crude Company ETFs characteristic influence their investment performance in the stock market. <Table 2> displays the Crude ETPs listed in the KRX, in fact, the leverage products are only available for the Crude ETNs as shown on <Table3>.
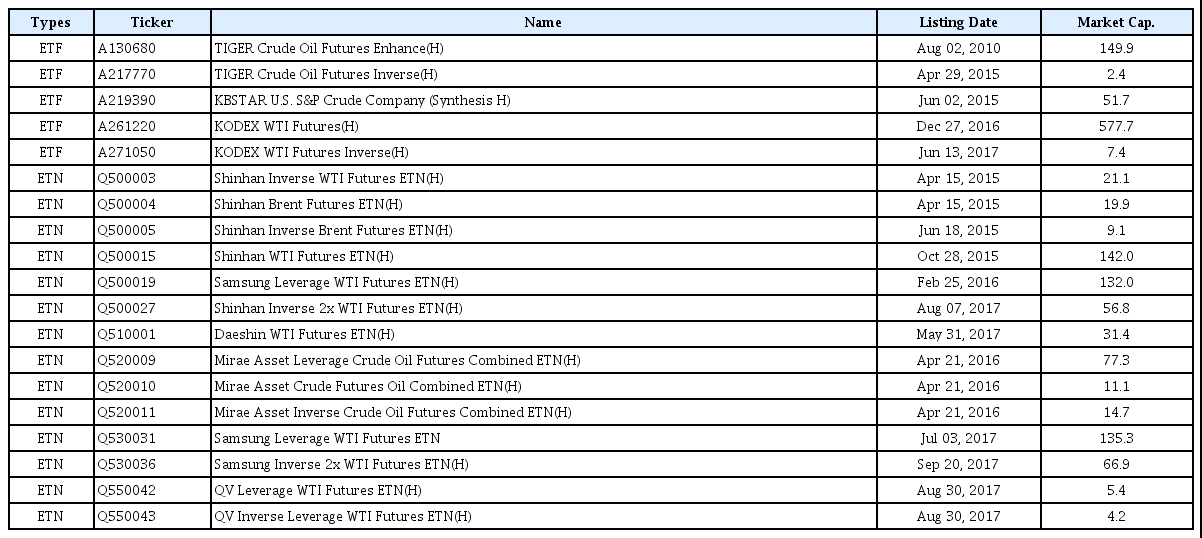
Crude ETPs listed in KRX
Market capitalization in total is as of September 22, 2020. (Unit: KRW Bn)

Crude ETPs for the Sample Data
Market capitalization in total is as of September 22, 2020. (Unit: KRW Bn)
A great disparity in the crude oil leverage ETNs was discovered in the first half of 2020. The structure of leverage, inverse, inverse-leverage ETNs listed on the KRX follow a daily rate of return by 2x, -1x, and -2x instead of underlying asset price by 2x, -1x, and -2x. The disparity, therefore, is caused by the variance between the sum of the daily return and the sum of the underlying asset return are different for a certain period of time. The price disparity, in particular, can be widened as market volatility increases. In this study, the investment performance of crude oil leverage ETNs, which was an issue in the first half of 2020, was compared to the crude oil spot. The Crude ETPs’ rate of return listed on <Table 3> was selected for the sample data in consideration of the listing date and the size of market capitalization on <Table1>, which the Crude ETPs are listed on the KRX. The sampling period was set from December 28, 2016 to September 22, 2020 because the listing date of KODEX Crude oil Futures ETF was on December 27, 2016 that is the latest among all other Crude ETPs.
3.2 Research Methods
There are three investing strategies in crude oil. The first, physical purchase of crude oil could be considered as one of the investment strategies; however, it is difficult because of storage and distribution costs in reality for individual investors. The second, investing in WTI Futures would be another strategy. In fact, numerous funds relating to the crude oil and the Crude ETPs invest in the crude oil futures. ETPs are managed as a method of investing in crude oil futures; however, an important note is that these crude oil futures price already involve the costs of storage and distribution. In contango, where the price of crude oil futures is higher than that of deferred month, rollover costs are incurred when rolling over to deferred-month futures as its expiration is close. In this case, the rollover costs impact on lowering the investment performance of the Crude ETPs. The third, by investing in the Crude Company ETPs can be considered as another investment strategy. In this way, the rollover costs do not incur; however, it is exposed to individual company’s inherent risks as well as systematic risks of the stock market; therefore, it would be unreasonable to assert that the Crude Company ETPs are always advantageous over the Crude ETPs. In addition, the Crude Company ETPs can be considered as an alternative investment for crude oil only when a consistent and significant positive correlation between the Crude Company ETPs and crude oil spot is confirmed. In this study, the correlation between the Crude Company ETPs and crude oil spot listed on the KRX was verified and investment performance of both was compared. According to the asset management company’s ETF manager, “the Crude Company ETF is a method that allows investors who want to embark money in raw materials to invest in a situation where they anticipate a strong stock market or consider it as a concept of portfolio diversification.” Another asset manager in charge of ETF said “the point at which the rollover cost of crude oil futures ETF is maximized is when the contango is expanding. In the case of backwardation, the rollover cost may not incur or rollover revenue could even possibly take place.” It has been confirmed that a Crude Company ETP currently listed on the KRX does not generate dividend income due to its operating structure. Crude Company ETFs listed on overseas stock market generate dividend income, but the one listed on the KRX has a structure in which it is difficult to add dividend income because costs such as swaps are incurred during the operation process. The fourth, Russian funds would be a financial instrument which is a way to invest in crude oil. Baek et al. (2018, 2020) found that the industrial structure of Russia is greatly influenced by crude oil and natural gas, and as a result, it was possible to confirm a significant positive correlation between the Russian stock market and crude oil spot. They also stated that there is advantage in a rate of return when investing in the Russian funds instead of the crude oil funds.
The only Crude Company ETP listed on the KRX is ETPa (ticker: A219390). The ETPa invests in companies that explore or produce oil or gas, or traces an index such as S&P Oil & Gas Exploration & Production Select Industry (SPXSOP). SPXSOP is an index composed of the US upstream companies, which explore or produce crude oil, and they are sensitive to the crude oil price. The Crude ETPs are expected to have high investment efficiency because they have no rollover costs, and this is seen as its strength; however, there could be low correlation between the Crude Company ETPs and crude oil spot. The Crude Company ETPs investing in individual companies, related to crude oil as raw material, are rather exposed to the company’s inherent risks as well as the stock market flow, apart from the price of crude oil. In order to examine correlation between the two in detail by an empirical analysis, the Hypothesis I is established:
Hypothesis I: There is correlation between the Crude Company ETFs and crude oil spot; however, a level of its correlation is lower than that between crude oil futures ETFs and crude oil spot.
Although it is known that the stock price and the rate of return for the crude oil related companies invested by the Crude Company ETPs are highly correlated to the price and the rate of return for crude oil spot, there is no previous research to figure out the correlation between the ETPa and the crude oil spot listed on the KRX. The correlation between the daily rate of return for the crude oil spot on t-1 and three ETFs on t-day were investigated in this study. To sort the three ETFs, the size of the market capitalization and the listing date were considered, and they are as follows: (1) ETPa, (2) ETPb, (3) ETPc. The trading hour of the international crude oil market on t-1 is the dawn of Korea on t-day. The WTI spot market is traded from 10:30 PM on t-1 to 04:30 AM on t-day at the NYMEX. However, it is traded from 09:30 PM on t-1 to 03:30 AM on t-day during the summer time. The sampling period is from December 28, 2016 to September 22, 2020, taking into account the listing date of the ETPs used to confirm the support of the Hypothesis I.
Since the trading hour for the Crude Company ETF, Crude ETPs and crude oil spot varies from each other, the time difference was applied in a statistical analysis. The correlation between the daily rate of return for crude oil spot on t-1, open rate of return for the Crude Company ETF and the two crude oil futures ETFs is investigated by using the Vector Autoregression (VAR) model. The VAR is the most common model when there is time difference in sample. A purpose of the study is to probe the correlation between crude oil spot and its related ETFs; thus, the regression equation is the same as this model whose explanatory variable is set by the daily rate of return on crude oil spot at t-1 for both the Crude Company ETF and the two crude oil futures ETFs on day t, taking into account the time difference. However, in order to consistently explain the impulse response function of each variable, the contents were organized by the VAR model.
The unrestricted VAR model analysis of Equation (1) was estimated for an empirical analysis using a regression applied by the VAR model with the sample based on the rate of returns for all variables.
WTIt is the daily rate of return on crude oil spot. ETPat, ETPbt, and ETPct is the open rate of return on KB Crude Company ETF, KODEX Crude Oil Futures ETF, and TIGER Crude Oil Futures ETF, respectively. Rt refers to the vector of four variables, C and As refer to the coefficient matrix, and m refers to the length of lag. et is a prediction error vector when Rt is estimated by using the past Rs. It was assumed that the time series of et was independent. The term of i and j in the matrix of As measure how a rate of return at j-th affects that at i-th.
Hypothesis II: The investment performance of Crude Company ETF is higher than that of ETFs operated as crude oil futures.
If there is positive correlation between the Crude Company ETF listed on the KRX and crude oil spot, it is possible to invest in crude oil futures ETFs as well as the Crude Company ETFs for a purpose of the crude oil investment based on the empirical test result of the Hypothesis I. Baek et al. (2020) argued that since crude oil funds sold in Korea are managed as crude oil futures, so rollover costs are incurred and the yield is lower than crude oil spot. On the other hand, Russian funds, which show a positive correlation with crude oil funds, do not incur rollover costs because they invest in the Russian stock market and additionally generate a high dividend yield, which is advantageous investment performance over risks born. The Crude Company ETFs, similar to the Russian funds, are structured to invest in individual enterprise’s shares and do not incur rollover costs. However, the ETPa listed and traded in Korea does not generate dividend income and it is rather exposed to an inherent risk of the company and a systematic risk of the stock market; therefore, it was necessary to measure investment performance against the risk of crude oil futures ETFs and the Crude Company ETF.
Based on the preceding arguments, the Hypothesis II was established, and the results were compared and analyzed by using the Sharpe index. The sampling period is from December 28, 2016 to September 22, 2020. It is meaningful to compare and measure not only the risk-adjusted investment performance between the Crude Company ETF and the crude oil futures ETF, but also the performance of the crude oil spot by comparing the investment performance against the risk of crude oil spot. After all, the main purpose to invest in Crude ETPs is to track the rate of return for crude oil spot appropriately. The formula for the Sharpe’s index is shown in Equation (2). The Sharpe index for each of ETPa, ETPb, ETPc, and crude oil spot were calculated and then compared accordingly. The Sharpe index is a measure of the excessive return that can be earned by investing in a unit of risky asset e.g., stocks. In Equation (2), Rp is the portfolio rate of return, Rf is the risk-free rate, and σp is the standard deviation of the return rate of the portfolio.
Hypothesis III: When the spot price of crude oil rises, an investment performance of crude oil futures ETF is higher than that of the Crude Company ETF. And when the spot price of crude oil falls, an investment performance of the Crude Company ETF is higher than that of crude oil futures ETF.
Contango in which futures price is formed higher than spot price due to storage costs, etc., is called the normal market in general. Conversely, backwardation, in which spot price is formed higher than futures price, is known to be a case when spot price drops sharply. However, in the crude oil market, there are many cases where backwardation occurs when the price of crude oil rises. This is interpreted as speculative demand for the nearby month crude oil futures, rather than the deferred month, increases in the phase of rising oil prices. In the international crude oil market, the spot price of crude oil is usually the nearby month price of the WTI Futures. Due to characteristic of the crude oil market, backwardation takes place when the crude oil price rises. It leads to the better investment performance of the crude oil futures ETF due to the reduction in rollover cost or incurrence of rollover revenue. On the contrary, a futures price of nearby month used for a spot price in the crude oil market showed relatively larger degree of decline, so the contango is created and this causes the rollover cost when there is a decrease in the crude oil price. To support the Hypothesis III established earlier in this paper, a periodic rate of return and the Sharpe index were calculated and compared for each of following sample data: ETPa, ETPb, ETPc, and crude oil spot. It was taken as the sampling period from December 28, 2016 to September 22, 2020. In addition, the entire sample was divided into an increase period and a decrease period in oil prices, and during the sample period, the increase period and the decrease period were set based on the peak of crude oil price.
Hypothesis IV: Crude oil leverage ETP has lower investment performance over a certain period of time compared to 1x crude oil related ETP.
In the course of a sharp decline in crude oil prices in the first half of 2020, crude oil leverage ETP investors suffered from significant losses. In the case of leverage inverse ETP, due to the structural characteristics of the product, there is a different investment risk compared to the ETP tracking 1x of the underlying asset. Leverage, inverse and leverage-inverse ETP trace 2x, -1x, -2x of a daily rate of return on its underlying asset. They do not simple follow 2x, -1x, -2x of a daily price fluctuation for a certain period of time. Therefore, a difference between the sum of the daily rate of returns and the return rate of the underlying assets for the certain period is resulted. As volatility increases, the index fluctuates more severely, the loss of leverage, inverse, and leverage-inverse ETP is magnified regardless of the price of the underlying asset remains flat. If the underlying asset price rises or falls continuously for a certain period of time, the yield of leverage, inverse, or leverage-inverse ETP can give a higher rate of return compared to the underlying assets due to a compounding effect; however, it is very unlikely that the underlying asset to show such a movement for a certain period of time in reality, accordingly, the investment performance of crude oil leverage ETP will be lower than that of 1x crude oil related ETP as the Hypothesis IV established. To verify the Hypothesis IV, the periodic rate of returns and the Sharpe index of ETPc, ETPd, ETPf and crude oil spot were measured and compared.
4. Empirical Results
4.1 Correlation between Crude oil Spot and Crude Company ETF
<Table 4> shows the summary statistics of four variables before analyzing the VAR model between the daily rate of return for crude oil spot, and the open rate of return for Crude Company ETF and crude oil futures ETF listed on the KRX. It can be seen that the standard deviation, the maximum and minimum of the ETPa open rate of return (ETPat) are smaller than other variables. In other words, that Crude Company ETFs have a better stable movement than those ETFs operated by crude oil spot and futures. This suggests that the volatility of crude oil spot is higher than that of the Crude Company stocks listed. Meanwhile, on April 20, 2020, the spot price of crude oil recorded a negative 37.63 dollars per barrel for the first time in history. In a situation where demand declined due to the COVID-19 outbreak and storage space was scarce, the rollover transaction of liquidating May products and buying June products as the May crude oil futures approached to the maturity was rushing to record the negative(-) price. This is due to a feature of the futures market that uses the nearby month futures price as the spot price of crude oil. A statistical bias may occur if the negative spot price of crude oil, -$37.63, on April 20, 2020 is taken into account. In this study, the average price based on the crude oil spot closing price on April 19 and April 21 was used as the adjusted price for April 20. The maximum and minimum of the crude oil spot daily rate of return (WTIt) were 28.257% and -29.208%, successively, indicating that the fluctuation was very large compared to other variables, and this reflected on the standard deviation of crude oil spot which was higher than other variables. Both the ETPb open rate of return (ETPbt) and the ETPc open rate of return (ETPct) are operated as crude oil futures, but the difference between the maximum and minimum value was huge. It is because an operating method for the two ETFs are different to each other.
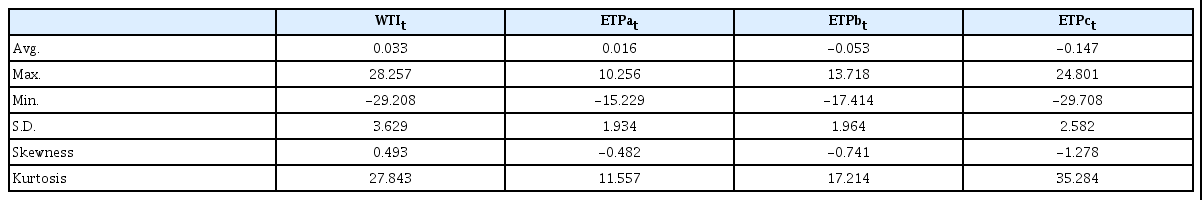
Summary Statistics
WTIt is the daily yield of crude oil spot on t-day, and ETPat, ETPbt, and ETPct are open price return of KB Crude Company ETF, TIGER Crude Oil Futures, and KODEX Crude Oil Futures ETF on t-day, respectively. The unit of average, maximum, and minimum is percent (%). The sampling period is from December 28, 2016 to September 22, 2020.
<Table 5> displays the result of the correlation analysis between the daily yield of crude oil spot on t-1 (WTIt-1) and the open price return of the KB Crude Company ETF (ETPat), TIGER Crude Oil Futures ETF (ETPbt), and KODEX Crude Oil Futures ETF (ETPct) on t-day. It was confirmed that WTIt-1 had the high correlation with ETPbt, ETPct of 0.629 and 0.672, respectively. In addition, it was discovered that WTIt-1 had the correlation of 0.389 with ETPat, where as ETPat was correlated with ETPbt, ETPct of 0.564 and 0.460, successively. Through this correlation analysis, it is possible to examine a certain level of the tendency among variables, but additional statistical estimation is essential since the mutual influence of the variables cannot be corroborated.
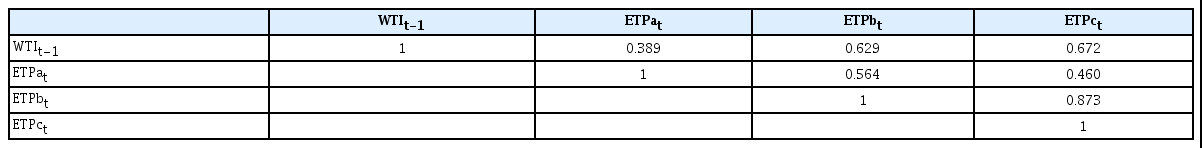
Correlation Analysis
WTIt is the daily yield of crude oil spot on t-day, and ETPat, ETPbt, and ETPct are open price return of KB Crude Company ETF, TIGER Crude Oil Futures, and KODEX Crude Oil Futures ETF on t-day, respectively. The unit of average, maximum, and minimum is percent (%). The sampling period is from December 28, 2016 to September 22, 2020.
The autocorrelation coefficients of the four variables were listed in <Table 6>. If the variables have high autocorrelation, the residuals estimated in the regression model will also show autocorrelation, which implies that the reliability of t-statistics, significance level and R2 would be lowered, even if a consistent estimate is obtained in the regression model. The most of the four variables showed low autocorrelation as shown in <Table 6>. There was a tendency of low autocorrelation when using yield data instead of price data, and all four variables are based on the yield data.
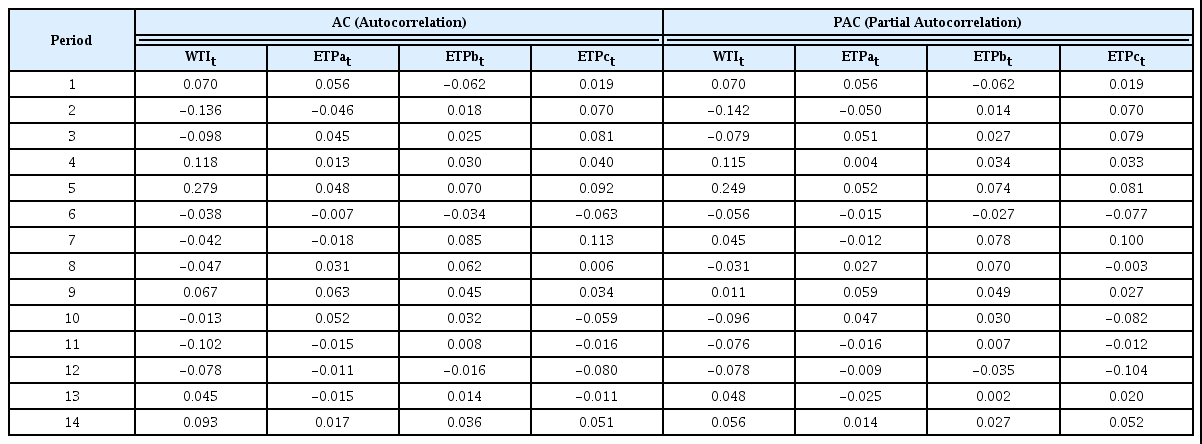
Analysis of Autocorrelation
WTIt is the daily yield of crude oil spot on t-day, and ETPat, ETPbt, and ETPct are open price return of KB Crude Company ETF, TIGER Crude Oil Futures, and KODEX Crude Oil Futures ETF on t-day, respectively. The sampling period is from December 28, 2016 to September 22, 2020.
In <Table 7>, the Augmented Dicky-Fuller test (ADF test) examined whether the variables used in the regression analysis follow a random walk. A unit root exists if the variables satisfy the random walk, and even if there is no correlation, spurious regression can be appeared in which the regression analysis result is significant. The ADF test in general assumes the existence of a unit root as a null hypothesis, which was rejected at the significance level of 1% or less for all four variables; therefore, WTIt, ETPat, ETPbt and ETPct did not have a unit root.
Unit Root Test
WTIt is the daily yield of crude oil spot on t-day, and ETPat, ETPbt, and ETPct are open price return of KB Crude Company ETF, TIGER Crude Oil Futures, and KODEX Crude Oil Futures ETF on t-day, respectively. The lowest SIC value in the maximum of 21 lagged values was standardized for the time lag of the ADF test. The sampling period is from December 28, 2016 to September 22, 2020.
Dozens of the Crude Company ETFs are listed and traded on the US stock market, but ETPa by KB Asset Management is the only Crude Company ETF listed on the KRX. Usually, the Crude Company ETF invest in crude oil-related producers, and it is estimated that there will be a correlation with crude oil spot. This study statistically analyzed the correlation between the market yield of the only Crude Company ETF listed and traded on the KRX, and the daily rate of return on crude oil spot. The ETPa traces the S&P Oil & Gas Exploration & Production Select Industry Index consisting of 74 oil and gas exploration and production companies listed in the United States. Due to the difference in trading hours between the crude oil spot market and the KRX, the daily yield on the t-1 will affect the open rate of return on the ETPa on t-day. The daily rate of return on crude oil spot at t-1 was calculated by dividing the spot price of crude oil on t-1 by that on t-2, and then, subtracting one. In addition, the ETPa’s open rate of return on t-day was calculated by dividing the opening price on t-day by the closing price of t-1, and then subtracting one. Apart from looking into the correlation between the daily rate of return on crude oil spot at t-1 and the open return rate of the ETPa by applying the VAR model, the two other ETFs listed on the KRX, ETPb and ETPc at t-1 were added to the variables in order to investigate a correlation with the daily return rate of crude oil spot.
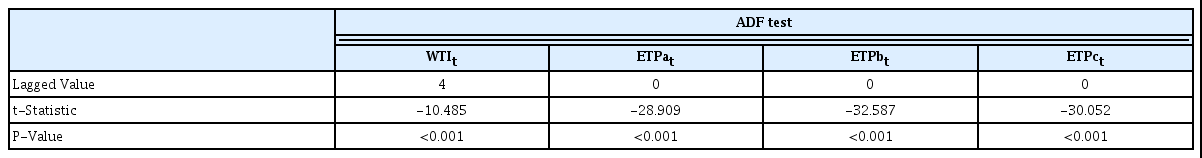
The Schwarz Criterion (SC) was applied to determine the time lag of the VAR model estimation in <Table 8>. The time lag of Phase one, two, three, and four in the SC values were 16.038, 15.987, 15.945, and 15.957, respectively, which demonstrated that the minimum SC value was found on the time lag of Phase 3; thus, it was eventually estimated based on the value of m in <Table 8>. As a result of the VAR model estimation, the daily yield of crude oil spot on t-1 had a significant correlation of 1% with the open price return of the ETPb and ETPc on t-day. The daily yield of crude oil spot on t-1 correlated with each of the open return rate on the ETPb and ETPc at the significant level of 1%. Each of t-statistics were 28.166 and 32.755, which were relatively high. In addition, the daily yield of crude oil spot on t-1 showed the coefficient value of 0.219** with a significance level of 1% to the open rate of return on the ETPa on t-day, and the t-statistic was 13.423. It is possible to invest in the Crude Company ETF as well as crude oil futures ETFs for investors who expect the crude oil price rises. Therefore, an interpretation of these results support the Hypothesis I (There is correlation between the Crude Company ETFs and crude oil spot; however, a level of its correlation is lower than that between crude oil futures ETFs and crude oil spot).
Analysis of Unrestricted VAR
WTIt is the daily yield of crude oil spot on t-day, and ETPat, ETPbt, and ETPct are open price return of KB Crude Company ETF, TIGER Crude Oil Futures, and KODEX Crude Oil Futures ETF on t-day, respectively. The lowest SIC value in the maximum of 21 lagged values was standardized for the time lag of the ADF test. ** means statistically significant at the level of 1%. The sampling period is from December 28, 2016 to September 22, 2020.
Before performing variance decomposition and impulse response analysis using the VAR model, it is important to note that certain restrictions are required on the interaction between variables at the same time point. If there are no restrictions, a problem arises that the structural model used in the reduced form1), for estimation cannot be determined. If there is a clear theory about the relationship between variables, it can be used as a constraint; however, there is no clear theory about the correlation among crude oil spot, crude oil futures ETF and the Crude Company ETF. Hence, exogeneity was estimated, and the Cholesky ordering method by using the level of this exogeneity was applied. The degree of exogeneity between variables was identified by Granger (1969, 1980) causality test, and the result are shown in <Table 9>.

Granger Causality Test
WTIt is the daily yield of crude oil spot on t-day, and ETPat, ETPbt, and ETPct are open price return of KB Crude Company ETF, TIGER Crude Oil Futures, and KODEX Crude Oil Futures ETF on t-day, respectively. The sampling period is from December 28, 2016 to September 22, 2020.
WTIt was causal to all other variables at a significance level of 1% or less as a result of the Granger causality test in <Table 9>. Contrarily, the degree to which other variables are causal to WTIt is lower or the other variables were not causal to WTIt. According to the Granger causality test, ETPat was causal of ETPct; however, ETPct was not causative of ETPat. The Granger causality was found in ETPbt against ETPct at a significant level of below 5%, but ETPct did not cause ETPbt. Although ETPat and ETPbt did not have a mutual Granger causal relationship, the degree of exogeneity was measured by using the significance probability level. Finally, the variance decomposition and impulse reaction analysis were performed by implementing the Cholesky ordering as shown in <Table 10> and <Table 11>, after assuming that the exogeneity was high in the order of WTIt, ETPat, ETPbt, and ETPct.

Analysis of Variance Decomposition
WTIt is the daily yield of crude oil spot on t-day, and ETPat, ETPbt, and ETPct are open price return of KB Crude Company ETF, TIGER Crude Oil Futures, and KODEX Crude Oil Futures ETF on t-day, respectively. The sampling period is from December 28, 2016 to September 22, 2020.

Impulse Response Analysis
WTIt is the daily yield of crude oil spot on t-day, and ETPat, ETPbt, and ETPct are open price return of KB Crude Company ETF, TIGER Crude Oil Futures, and KODEX Crude Oil Futures ETF on t-day, respectively. The sampling period is from December 28, 2016 to September 22, 2020.
<Table 10> portraits the variance decomposition result for the forecast error variance of the VAR model. Each number represents how much weight the upper variables influence the forecast error variance in the left variables in percentage. In the analysis of the variance decomposition, it is worth noting that 96.943% of the forecast error variance of WTIt was explained by itself at the Period 5, and the weight of WTIt on the top contribute to each of the variables on the left. The forecast error variance of ETPat at the Period 5 was elucidated by 82.123% itself, and by WTIt with a constant weight of 16.904%. At the Period 5, 41.823% delineated the forecast error variance of ETPbt by itself, and 47.403% of WTIt showed the highest explanatory power to ETPbt. The forecast error variance of ETPct was explicated by itself and WTIt of 19.302%, 51.136%, consecutively. That is, the daily rate of return on crude oil spot deciphered the forecast error variances for the daily rate of return on the crude oil futures ETFs and Crude Company ETF at a consistent explanatory power. The variance decomposition result expounded the Hypothesis I (There is correlation between the Crude Company ETFs and crude oil spot; however, a level of its correlation is lower than that between crude oil futures ETFs and crude oil spot) is well supported.
The reaction of the open return rate on both the Crude Company ETF and crude oil futures ETF against the impulse of crude oil spot was analyzed in <Table 11>. It was confirmed how ETPat, ETPbt, and ETPct react when an impact of one standard error is given to the daily yield of crude oil spot (WTIt). The positive coefficient values of ETPat, ETPbt, and ETPct were large at the Period 2 in the impulse reaction analysis on the daily yield of crude oil spot in <Table 11> due to the time lag. The reason for the time lag is the daily return rate of crude oil spot on t-1 is calculated at the dawn of t-day in Korea. In other words, the effect in the Period 2 was greater than that in the Period 1 after the shock. The response of the two other crude oil futures ETFs, ETPbt, and ETPct, against WTIt are 1.309, 1.826, respectively, which is bigger than that of the open return for ETPat against WTIt, recorded 0.778. This result confirmed the Hypothesis I (There is correlation between the Crude Company ETFs and crude oil spot; however, a level of its correlation is lower than that between crude oil futures ETFs and crude oil spot).
The impulse response analysis of <Table 11> are illustrated by the graph of <Figure 1>. Each of graphs demonstrated that ETPat, ETPbt, ETPct have a large response for the Period 2 when the impact of one standard error is given to the daily yield of crude oil spot, WTIt.

Impulse Response Analysis Graph
WTIt is the daily yield of crude oil spot on t-day, and ETPat, ETPbt, and ETPct are open price return of KB Crude Company ETF, TIGER Crude Oil Futures, and KODEX Crude Oil Futures ETF on t-day, respectively. The sampling period is from December 28, 2016 to September 22, 2020.
4.2 Comparison of Investment Performance of Crude Company ETF and Crude oil Futures ETF
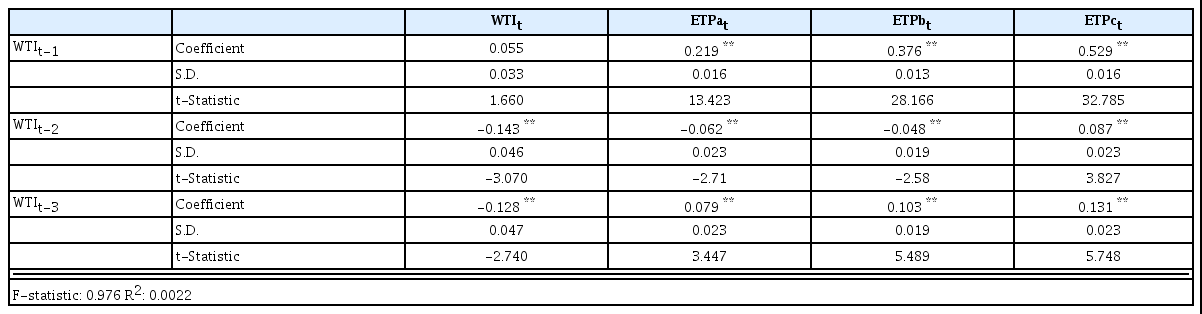
Not only crude oil futures ETFs operated as crude oil futures but also Crude Company ETF investing in crude oil production companies had a significant correlation with crude oil spot as proven in the 4.1 previously. In Korea, the only one Crude Company ETF is listed and traded, but dozens of crude oil producing company ETFs are traded in the US, dividing into the three sectors: upstream, midstream, and downstream. The upstream refers to the exploration and production of oil and natural gas, while the midstream is the production of everything needed to transport and store before refining. The downstream is the field of converting crude oil and natural gas into finished products. The ETPa listed in Korea is based on the index2), composed of the US upstream companies. An increase in investment efficiency is expected by reducing investment costs owing to the fact that the Crude Company ETF invests in the stock market. The Crude Company ETFs do not incur the rollover cost, which is a different aspect compared to the crude oil futures ETFs. The Crude Company ETFs listed in the US could expect dividend income which increases the ETF base price, contrarily, the E of Korea does not generate dividend income due to swap costs. It was confirmed in <Table 12> whether the Crude Company ETFs, whose correlation with crude oil spot was confirmed, had higher risk-adjusted investment performance than the crude oil futures ETFs. The periodic yield of WTI, ETPa, ETPb, ETPc recorded the loss of -26.75%, -75.29%, -57.90%, and -69.61%, consecutively during the sampling term from December 28, 2016 to September 22, 2020, and all of the periodic return rate of the crude oil-related ETFs were lower than that of crude oil spot. The ETPa, especially, had the biggest loss of -75.29% among all others. It was interpreted that when oil prices decline, profitability of crude oil producers deteriorates. This led to a financial risk aggravates the company’s losses, which eventually caused a decrease in stock price. Furthermore, the periodic yield of two other crude oil futures ETFs during the same period of time put on record of the huge losses, -57.90% and -69.61%, which was larger than the loss of crude oil spot periodic return. This was conveyed as due to investment costs such as rollover costs, fund management fees, and currency hedging costs incurred in the process of operating crude oil futures ETFs. In the international financial market, crude oil spot prices use nearby month prices of crude oil futures. In the course of a sharp decline in oil prices, contango tends to expand as the price of nearby month futures falls significantly compared to the deferred month futures.
Comparison of Investment Performance of Crude Oil-Related ETFs
WTI is crude oil spot, ETPa, ETPb, and ETPc are KB Crude Oil Enterprise ETF, KODEX Crude Oil Futures ETF and TIGER Crude Oil Futures ETF, respectively.
Panel A: Dec 28, 2016 ~ Sep 22, 2020
The risk-free abnormal return of crude oil spot is 7.51%, which was higher than that of crude oil-related ETFs; -31.54%, -15.70%, -21.09%. The volatility of crude oil spot was 57.61%, which was also higher than that of crude oil-related ETFs; 36.49%, 39.16%, 46.38% as well. Thus, it was necessary to compare the Sharpe index, which measures a risk-adjusted investment performance. The Sharpe index of crude oil spot was 0.130, which was the only positive value, whilst the Sharpe index for the remaining crude oil-related ETFs was -0.864, -0.401 and -0.455, respectively. The Sharpe index of the ETPa was exceptionally low out of all other sample data. This result does not support the Hypothesis II (The investment performance of Crude Company ETF is higher than that of ETFs operated with crude oil futures).
The whole sample, Panel A in <Table 12>, dated from December 28, 2016 to September 22, 2020 was divided into the two different time periods in order to verify the robustness of the result derived previously; the former sample, Panel B, was used as an estimated sample, and the latter sample, Panel C, was used as a verification sample to compare with the result of the whole sample.
The estimated sampling period was set from December 28, 2016 to October 3, 2018. The reason is that the spot price of crude oil peaked at $76.41 per barrel on October 3, 2018 during the entire sampling period as shown in <Figure 2>, afterwards the oil price has declined. The verification sample period is from October 4, 2018 to September 22, 2020. Another practical benefit of dividing the sample is that it is possible to check whether the result of the entire sampling period is due to the sharp fluctuation of the oil prices in the first half of 2020, which is included in the verification sample period.
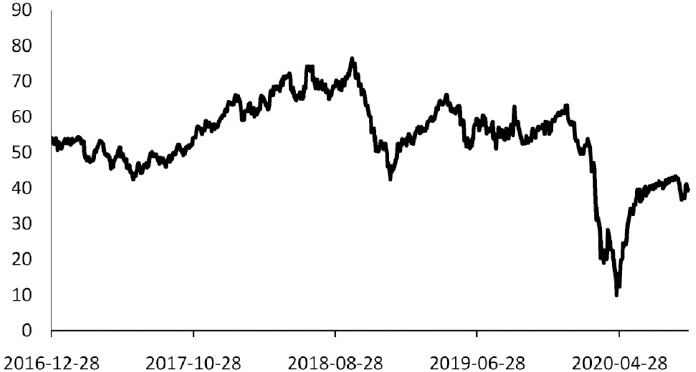
Crude Oil Spot Price Trend
The sampling period is from December 28, 2016 to September 22, 2020. As of October 3, 2018, when the peak during the same period was recorded, additional analysis was performed by dividing into estimated and verified samples.
The crude oil prices showed a solid rise during the estimated sample period (Dec 28, 2016 ~ Oct 3, 2018) of Panel B in <Table 12>. In the same period when the spot price of crude oil increased steadily, the Sharpe index of the ETPa was 0.125, which was significantly lower than that of the crude oil spot, 0.883, and the two crude oil futures ETFs, 0.706, 0.819. This result does not support the Hypothesis II (The investment performance of Crude Company ETF is higher than that of ETFs operated with crude oil futures). The nearby month price of crude oil futures used as the spot prices of crude oil rise, causing the backwardation in which the nearby month price is higher than the deferred month price. As rollover costs are eliminated and rollover revenues might be generated in the situation of the backwardation; thus, the crude oil futures ETF’s performance can be relatively improved. As a result, there was no significant difference between the Sharpe index of crude oil spot (0.883), and of crude oil futures ETFs (0.706, 0.819), which was dissimilar to the whole sample period. For this reason, the difference between the Sharpe index of the ETPa (0.125), and of Crude Oil Futures ETFs (0.706, 0.819) during the same period was enlarged in comparison to the whole sample period (-0.864 vs. -0.401, -0.455) and the verification sample period when the spot price of crude oil declined (–1.371 vs. -0.856, -0.956).
The verification sample period (Oct 4, 2018 ~ Sep 22, 2020) of Panel C in <Table 12> was the time when oil price plunged, unlikely the estimated sample period of Panel B. In particular, the situation was contrary to Panel B, including the first half of 2020 when oil prices plummeted and volatility escalated. During the same period, the Sharpe index of the Crude Company ETF (-1.371) was lower than that of the two crude oil futures ETFs (-0.856, -0.956), but the difference was smaller than that of Panel B where oil prices rose. Moreover, the variance between the Sharpe index of the crude oil spot (-0.071), and of crude oil futures ETFs (-0.856, -0.956) was widened more than that of Panel B when the oil price increased (0.883 vs. 0.706, 0.819). The reason could be found in the verification sample period of Panel C, where the crude oil spot price dropped. The price of nearby month futures of which was used for the crude oil spot price declined, whose price difference with a deferred month product was enlarged; that is, the rollover costs increased, led to a fall in base price of ETFs as a result of the contango expansion. The Hypothesis II (The investment performance of Crude Company ETF is higher than that of ETFs operated with crude oil futures) was, therefore, rejected. In other words, it was confirmed that the risk-adjusted investment performance of the Crude Company ETF was lower than that of crude oil futures ETF in all sections of the whole sample; the estimated sample and the verification sample. Also, the Hypothesis III (When the spot price of crude oil rises, an investment performance of crude oil futures ETF is higher than that of the Crude Company ETF. And when the spot price of crude oil falls, an investment performance of the Crude Company ETF is higher than that of crude oil futures ETF.) could not be supported. However, it could be construed that the performance of crude oil futures ETF, which is operated as crude oil futures during the rising spot price of crude oil, is advantageous in terms of investment costs such as rollover costs compared to the period of the crude oil spot price fallen. As a result, the periodic yield and Sharpe index of the Crude Company ETF were lower than that of crude oil futures ETF in all sections, notwithstanding there was a difference in degree.
4.3 Analysis of Investment Performance of Leverage ETN
Generally speaking, structural features of leverage ETP and inverse ETP have different investment risks from a usual ETP, which affect return on investment. Leverage ETF is a high-risk product that can earn more profits when the price of investment assets rises, but also increases a size of loss when the price of investment assets falls. Leverage ETP and inverse ETP do not simply follow the 2x, -1x, or -2x of the underlying assets price in the certain period such as six months, one year, or so. They are operated with a goal of 2x, -1x, or -2x of a daily rate of return. Additionally, it has an operating structure that can generate 2x, -1x, and -2x of the daily return rate based on the closing price since each investor has different investment timing. For this reason, the cumulative rate of return of the leverage ETP and the inverse ETP for a certain period of time may differ from the sum of the daily return rate at which compounding effects occur. If volatility enlarges and fluctuates as in the first half of 2020, the compounding effect for leverage ETP and inverse ETP may be lower than the underlying asset price return. In order to corroborate that the investment performance of the leverage ETP and inverse ETP, including periods of expanding volatility, will be low; thus, the Hypothesis IV (Crude oil leverage ETP has lower investment performance over a certain period of time compared to 1x crude oil related ETP) was established. The term yield and Sharpe index of crude oil spot (WTI), KODEX Crude Oil Futures ETF (ETPc), Shinhan Crude Oil Leverage ETN (ETPd), Mirae Asset Crude Oil Leverage ETN (ETPf) were examined as the sample for an empirical analysis. The whole sampling period was from December 28, 2016 to September 22, 2020, and was divided into an uptrend sample (Dec 28, 2016 ~ Oct 3, 2018) and a downtrend sample (Oct 4, 2018 ~ Sep 22, 2020). In the entire sample period of Panel A in <Table 13>, the periodic return of the two leverage ETNs were -98.25% and -91.92%, respectively. During the same period in the first half of 2020, the yield of the leverage ETN showed a sharp decline in the course of crude oil prices oscillated. For example, the crude oil price was $41.28 per barrel as of March 6, 2020, and it recorded $41.11 per barrel on September 18, 2020. Its periodic return rate of crude oil spot was almost flat at -0.41% for circa six months. The prices for the two leverage ETNs, however, fell steeply from ₩7,345 and ₩13,345 to ₩305 and ₩2,080, consecutively in the same period of time. Besides, the periodic returns of them were -95.85% and -84.41%, respectively. The yield of the leverage ETNs with the compounding effect bespoke a big disparity from the periodic return of the underlying assets. This overall result, therefore, supported the Hypothesis IV (Crude oil leverage ETP has lower investment performance over a certain period of time compared to 1x crude oil related ETP).

Investment Performance of Leverage Crude oil ETP
WTI is crude oil spot, and ETPc, ETPd and ETPf are KODEX Crude Futures ETF, Shinhan Crude Oil leverage ETN, and Mirae Asset Crude Oil leverage ETN, respectively.
Panel A: Dec 28, 2016 ~ Sep 22, 2020
In Panel A, the Sharpe indices of the two leverage ETNs (ETPd: -0.859, ETPf: -0.380) were lower than that of crude oil spot (0.130). However, the ETPd’s Sharpe index, -0.859, was even lower in comparison with the 1x crude oil futures ETF’s Sharpe index, -0.455, whereas, the Sharpe index of ETPf, -0.380, was rather higher. This result is due to the difference between the underlying indices of the two leverage ETPs; the ETPd is a product to trace the lead month return of WTI Futures by two times, and the ETPf is based on an index invested in Brent crude oil futures as well as WTI Futures. However, the WTI Futures are subject to real acquisitions, on the other hand, the Brent crude oil futures are not. In 2020, due to the decrease in demand for crude oil due to the CIVID-19, storage costs became an issue in the international crude oil market, and the volatility of the WTI Futures was greater than that of the Brent crude oil futures as a result. Therefore, each Sharpe index of the variables in <Table 13> could not be simply compared. Panel B, the sampling period from December 28, 2016 to October 3, 2018, in <Table 13> was a section where the crude oil spot prices inclined, that is, there is a high possibility that backwardation will form as the nearby month futures price rises, which is relatively larger than the deferred month. In the rising period of crude oil price, rollover costs may occur less, or rollover income could rather happen. The periodic rate of return and the Sharpe index of the two leverage ETNs were relatively higher than the whole period or the downturn period compared to the crude oil spot. In other words, there was no remarkable difference between the Sharpe indices for crude oil spot (0.883), crude oil futures ETF (0.819), and crude oil leverage ETNs (0.847, 0.916).
Panel C of the sampling period from October 4, 2018 to September 22, 2020 in <Table 13> was a section where the spot price of crude oil dwindled. There is a high possibility of transpiring contango because the crude oil futures price of nearby month decreases even more than that of deferred month, which could be the section where rollover costs become greater. Reflecting this situation, the Sharpe index of ETPc (-0.956) and the two leverage ETNs (-1.625, -1.005) were consequentially lower than that of crude oil spot (-0.0071). The difference in the Sharpe index of the two leverage ETNs as -1.625 and -1.005, respectively, was confirmed by that the operating method and the underlying index of the two ETNs are dissimilar as described above.
5. Conclusions
This study examined the types and cost structure of crude oil-related ETPs, and correlation between each ETP and WTI spot market with the investment performance. The ETPs related to crude oil listed on the KRX were sampled and analyzed together with the WTI spot for the purpose of this investigation.
At first, as a result of the empirical analysis, there was the significant positive (+) correlation with the crude oil spot in the Crude Company ETF, which is listed only one in the KRX. The second, it was confirmed that since the crude oil futures ETP is operated as crude oil futures, the yield may be inferior to the crude oil spot due to investment expenses such as rollover costs incur. However, there is not a rollover cost because the Crude Company ETF invests in the shares of the crude oil producing companies in the stock market, which is obviously the spot market. Nonetheless, these companies are put at their intrinsic risks, hence, the return of the Crude Company ETFs is rather vulnerable. The Crude Company ETF performed worse than the crude oil futures ETF as a result of examining the periodic rate of return and risk-adjusted performance from December 28, 2016 to September 22, 2020. The result of dividing the entire sample period into an increase and a decrease in crude oil prices confirmed the similar result. Meanwhile, there is a high probability of a backwardation happened in the rising spot price of crude oil. In this situation, the price of crude oil futures for the nearby month which is applied as the crude oil spot price rises over the deferred month futures. As a result, it was confirmed that the investment performance of the crude oil futures ETPs is relatively higher in the period of rising crude oil prices than in the falling crude oil prices. Third, the investment performance of the crude oil leverage ETNs was deteriorated in the first half of 2020 because of the intensified volatility of the crude oil market. The leverage ETP and inverse ETP do not follow fluctuations of the underlying asset prices for a certain period of time. It could result in huge losses at a steady tone in the periodic return when the volatility is high. It is because their managing structure tracks the daily return of 2x, -1x, -2x, which leads to the compounding effects.
The highlight and creativity of this study are as follows: the first, KRX has formed a long box range around 2,000 points for more than ten years since 2007; thus, the return of direct and indirect investors for risky assets has been lower than the expectations. Because of fatigue from such disappointment, the investors rather pay attention to the alternative investment in order to augment the return of the investment. The raw material investment has recently become of interest by the investors; however, it leads to losses due to misunderstanding and confusion. In this study, it is conceivable to directly help investors in time to intuitively understand the performance and features of each ETP by looking into the operation structure and investment cost related to the Crude ETPs in comparison to the operation performance of each ETP based on the WTI spot market.
The second, studies on ETPs related to crude oil in the existing literature are rare, and there are few studies particularly investigated ETPs for the crude oil producing companies. The crude oil futures ETPs which incur rollover costs while the Crude Company ETPs have no rollover costs but are exposed to the inherent risks of the company. This is creative that the correlation between them and the performance for both were investigated in this paper, which were not found in the previous literature.
The third, the investment strategy using the crude oil-related ETPs is presented based on the results of the empirical analysis on the correlation between the crude oil spot market and investment performance of the crude oil-related ETPs. This approach will not only enhance the creativity of the research, but it will be of significance that it directly contributes to fund managers and management such as general investors and pension funds. In addition, it will assist the financial authorities to establish policies that have already taken a series of measures on the leverage ETP investment.
References
Notes
The unrestricted model used for empirical analysis in this study is also in reduced form.
S&P Oil & Gas Exploration & Production Select Industry Index.