ESG펀드의 포트폴리오 구성, 현금흐름, 성과에 관한 연구
ESG Fund Labels Matter: Portfolio Holdings, Flows, and Performance
Article information
Abstract
전 세계적으로 기업의 환경, 사회, 지배구조(ESG) 등 비재무적 요소를 투자에 반영하려는 움직임이 확산되고 있다. 특히 코로나19 상황 및 정부의 탄소중립 정책 등으로 인해 국내에서도 ESG에 대한 논의와 관련 투자 상품 출시가 이어지고 있다. 그러나 일각에서는 ESG를 표방하고 있는 펀드 상품이 일반 펀드와 크게 다르지 않으며 일종의 마케팅 수단에 불과하다는 비판이 제기되고 있다. 따라서 본 연구는 펀드의 포트폴리오 구성, 현금흐름 및 성과를 중심으로 ESG 펀드와 일반 펀드가 다른 속성을 갖는지 연구한다. 본 연구는 2012년 7월부터 2020년 12월까지 국내 액티브 뮤추얼펀드를 대상으로 하였으며, 성향점수매칭법(Propensity Score Matching)을 이용하여 표본을 구성하였다. 연구 결과는 다음과 같다. 첫째, ESG 펀드는 현금흐름, 변동성, 회전율 등에서 일반 펀드와 비슷한 특성을 보였으나, ESG 점수는 통계적으로 유의하게 높게 나타났다. 둘째, 펀드의 성과-현금흐름 민감도를 측정한 결과, ESG 점수가 높을수록 민감도가 작게 나타났다. 셋째, ESG 점수는 Carhart(1997)의 4요인 모형에 의해 추정한 미래 위험조정수익률과 유의한 음의 관계를 가진다. 마지막으로 ESG 펀드 투자자의 펀드 선정 능력(스마트머니 효과)는 일반 펀드 투자자와 다르지 않았다. 본 연구는 ESG 펀드의 포트폴리오 구성을 직접적으로 비교함으로써 국내 ESG 펀드가 고유한 펀드 특성을 가지고 있으며 따라서 단순한 “ESG 워싱”이 아니라는 점을 시사한다.
Trans Abstract
This study investigates whether environmental, social, and governance (ESG) funds have distinct features from conventional funds based on holdings-based ESG scores, flows, and performance. We find that ESG funds have significantly higher ESG scores than conventional funds; ESG funds with higher scores significantly weaken flow-performance sensitivity; and their scores are negatively associated with risk-adjusted future performance. However, there is no evidence to support better selection skills among ESG fund investors than among non-ESG fund investors. By conducting a comprehensive analysis, this study suggests that ESG funds have distinct fund attributes, and thus, “ESG” is not a mere marketing rhetoric in the Korean fund market.
1. Introduction
As environmental, social, and governance (ESG)1), investing has become mainstream, modern fiduciary duties require investors to incorporate ESG factors into their investment decision-making processes (UNEP FI, 2005). This trend has particularly intensified following the coronavirus disease 2019 pandemic, promoting a more sustainable approach toward investing. In this context, by the end of 2020, the net assets of domestic active ESG funds reached 6.5 trillion KRW in Korea.2) However, the main criticism is that ESG investing is a marketing gimmick used to attract investors rather than fundamentally changing corporate behavior or reducing carbon emissions. More importantly, the rapid growth of ESG in Korea has given rise to debates on whether ESG funds fail to differentiate themselves from conventional funds in terms of portfolio holdings and investment styles. Thus, this study investigates whether ESG funds have features distinct from conventional funds, considering holdings-based ESG scores, flows, and performance.
The literature has extensively examined the investment styles and performance of ESG mutual funds compared to conventional funds. ESG investors derive their utility primarily from nonfinancial attributes and, thus, care less about financial performance than conventional investors (Benson and Humphrey, 2008; Renneboog et al., 2011). In terms of fund performance, existing literature shows that ESG funds’ performance is at best similar to or lower than that of conventional funds (El Ghoul and Karoui, 2017; Hamilton et al., 1993; Renneboog et al., 2008, 2011; Statman, 2000). The ESG screening process may constrain the risk-return optimization and negatively affect fund performance (Renneboog et al., 2008). Moreover, investors may sacrifice their financial returns to invest according to their social and environmental preferences (Jo et al., 2022; Riedl and Smeets, 2017).
We use the Korea’s active mutual fund data and examine the fund’s ESG score, flows, and performance. The ESG score is a value-weighted score constructed using the firm-level ESG scores of portfolio holdings. We conducted a 1:1 matching on the propensity score based on the ESG score, size, age, performance, expense ratio, turnover, and the number of stocks. The sample of ESG funds and matched conventional funds (non-ESG funds) had 1,707 and 1,542 observations, respectively.
Our empirical findings are as follows. First, ESG funds have significantly higher ESG scores than conventional funds, although we match them using fund ESG scores. Simultaneously, the ESG scores are affected by some common characteristics such as fund flow, volatility, turnover, R-square, and the number of stocks. Second, the flow-performance relationship of ESG funds is not different from that of non-ESG funds; however, it may depend on the level of ESG attributes. ESG funds with higher scores significantly weaken the flow-performance sensitivity. Third, the alphas and factor loadings of ESG funds are not significantly different from those of non-ESG funds, but ESG fund scores are negatively related to risk-adjusted future performance. Lastly, fund selection skills among ESG fund investors are not different from those of non-ESG fund investors.
This study contributes to the existing literature by conducting a comprehensive analysis of the holdings-based measure of the level of ESG, flows, risk factors, and returns of ESG funds. Wee et al. (2020) investigate the relationship between the Korean ESG level, performance, and flows from 2013 to 2017. However, our paper differs from Wee et al. (2020) in that i) it draws a direct comparison between ESG funds and a matched sample of conventional funds, and ii) it shows that ESG funds indeed have distinct fund attributes (i.e., a higher fund ESG score); thus, ESG are not a mere marketing rhetoric in Korea. Moreover, this study has important implications for investors who make investment decisions based on ESG factors. Many ESG-related products are now available in the marketplace in response to investors’ expectations regarding ESG issues. However, one of the key challenges investors face when selecting ESG products is that they are not certain of whether fund managers meet their ESG criteria or intend to greenwash. We thus provide evidence of the portfolio composition and investment decisions regarding ESG funds to help investors pursue their sustainability goals.
The remainder of this paper is organized as follows. Section 2 reviews the relevant literature. Section 3 explains the data and defines the variables used. Section 4 examines the ESG score, fund flow-performance relationship, and performance of ESG and non-ESG funds. Section 5 concludes the study.
2. Literature Review
The attributes of ESG funds, formerly socially responsible investing (SRI) funds, are different from those of conventional mutual funds. In mutual fund literature, past performance is one of the most important determinants of fund flows (Chevalier and Ellison, 1997; Del Guercio and Tkac, 2002; Sirri and Tufano, 1998). However, ESG investors seem less sensitive to past performance than conventional investors (Benson and Humphrey, 2008; Bollen, 2007; Renneboog et al., 2011). Instead, they are likely to derive utility from non-financial attributes in their investment decisions. For example, Benson and Humphrey (2008) and Renneboog et al. (2011) show that SRI fund flows are less sensitive to past returns than conventional fund flows. Furthermore, recent studies have provided direct evidence of ESG investors’ non-financial motivations; Riedl and Smeets (2017) find that intrinsic social preferences are an important determinant of investment decisions for ESG investors, whereas financial motivations play a relatively minor role in this context. Hartzmark and Sussman (2019) find that funds with the highest Morningstar sustainability ratings receive net inflows, whereas those with the lowest ratings experience net outflows. These results imply that ESG investors treat sustainability as a positive fund attribute.
Investor preference for the non-financial aspects of ESG funds leads to different implications for future fund performance. There are several competing hypotheses regarding whether ESG funds can generate superior performance, and previous studies have shown mixed results. On the one hand, ESG funds may underperform conventional funds because their screening process reduces the investment universe (Renneboog et al., 2008, 2011). On the other hand, ESG screens may eliminate poorly managed firms and leave firms with more sustainable profitability, thus generating superior performance (Derwall et al., 2005; Gil-Bazo et al., 2010). Empirical evidence generally shows that ESG and conventional funds exhibit similar performance (Hamilton et al., 1993; Renneboog et al., 2008, 2011; Statman, 2000). However, El Ghoul and Karoui (2017) find that high-scoring corporate social responsibility (CSR) funds are associated with poor future performance, suggesting that socially responsible funds are less desirable to performance-chasing investors. Riedl and Smeets (2017) argue that investors are willing to disregard financial performance to invest in accordance with their social and environmental preferences. Jo et al. (2022) find that an increase in air pollution is accompanied by an increase in green fund flows, suggesting that air pollution can be a crucial determinant of Chinese environmental fund flows.
As the ESG investing market has become mainstream, conventional investors tend to incorporate ESG criteria into their investment analysis and decision-making processes. Revelli (2017) asserts that SRI loses its ethical identity as the convergence of SRI and traditional investment creates hybrid funds that are predominantly financial. Joliet and Titova (2018) study US equity SRI funds and find that both active SRI and matched conventional funds integrate ESG information and financial criteria in their investment decisions. However, ESG funds do not necessarily lose their identity. Joliet and Titova (2018) show that SRI portfolios exhibit higher average sustainability scores. Alda (2020) examines UK equity pension funds and shows that conventional funds present similar ESG concerns as SRI funds. Nevertheless, SRI funds present higher ESG scores than conventional funds, suggesting that SRI funds preserve their nature.
3. Data
3.1 Base Sample and Variables
We obtain mutual fund data from the Korea Fund Ratings (KFR), which contains information on fund codes, fund names, inception date, expenses, total net assets (TNA) and net asset value (NAV) at the end of each month, and daily and monthly returns. The KFR also provides fund classifications for identifying ESG (SRI) funds. We include open-end equity funds and exclude index funds, passively managed funds (e.g., ETFs), and any funds with less than 12 months of return data.
Our sample period ranges from July 2012 to December 2020 because ESG ratings are being published since June 2012. To construct ESG scores at the fund level, we first obtain firm-level ratings in the overall ESG and ESG subcategories (E, S, and G) from the Korea Corporate Governance Service (KCGS). The KCGS publishes ESG ratings as S, A+, A, B+, B, C, and D; thus, we assign a score ranging from 7 (highest) to 1 (lowest). We standardize the firm-level ESG score by industry and then calculate the value-weighted fund-level ESG score using portfolio holdings. The KCGS has publicly disclosed ESG ratings on a yearly basis with different announcement dates.3) Accordingly, we assign the most recent yearly ESG score to each month t. ESG score (E, S, and G score) represents the fund-level ESG score (environmental, social, and governance score).
Based on the standard measure used in the literature (Sirri and Tufano, 1998), we define fund flow as follows:
where TNAi,t is the total net asset value of fund i at the end of month t, and ri,t is the fund return at month t. Flow is winsorized at the 0.05% and 99.5% levels. To measure a fund’s performance, we use both raw fund returns and alpha. Return is the average monthly return during the 12-month period, ending at the end of the month. Alpha is estimated based on CAPM, Fama and French’s (1993) three-factor model, or Carhart’s (1997) four-factor model, depending on the model specification.4) Taking Carhart’s (1997) four-factor model as an example, Alpha is calculated as follows:
where ri,t is the fund’s return in month t, rf , t is the risk-free rate, rmkt,t is the value-weighted market return, and SMBt, HMLt, and UMDt are the size, value, and momentum factors,5), respectively. For each month t, we estimate the factor loadings over the prior 36-month rolling window. Next, we compute the monthly abnormal returns using the estimated factor loadings. Alpha is the average abnormal return in the 12-month period ending at the end of the month. Rsquare is estimated from regression model (2); it captures the proportion of the fund’s return explained by Carhart’s (1997) four factors. A lower Rsquare may indicate a greater degree of active management (Amihud and Goyenko, 2013).
We include a series of fund-level control variables in our empirical analysis. LnTNA is defined as the natural logarithm of fund TNA in month t. LnAge is defined as the natural logarithm of the number of months observed since the fund’s inception. Volatility is the standard deviation of the monthly fund returns over the previous 12 months. Turnover is the maximum aggregated sales or aggregated purchases of securities divided by the average 12-month fund TNA. Expense is defined as total operating expenses divided by total NAV at the end of the previous month. LnNumStock is the total number of stocks in a fund portfolio.
3.2 ESG and non-ESG Funds
We obtain a list of ESG funds from the KFR6), and construct a sample of matched conventional funds (non-ESG funds) based on the propensity score matching methodology (Alda, 2020; Ammann et al., 2019). The initial sample consists of 565 equity mutual funds: 24 ESG funds and 541 conventional funds (1,707 and 40,070 fund-month observations, respectively). We estimate the propensity score as the similarity measure among funds, considering a logistic regression on fund characteristics based on the ESG score, size, age, performance, expense ratio, turnover, and the number of stocks.7), We conduct a 1:1 nearest neighbor matching, resulting in 24 ESG funds and 24 non-ESG funds (1,707 and 1,542 fund-month observations, respectively). <Figure 1> displays the distributions and QQ plots of the ESG score, suggesting that the matching procedure improves the baseline characteristics of ESG and non-ESG funds.
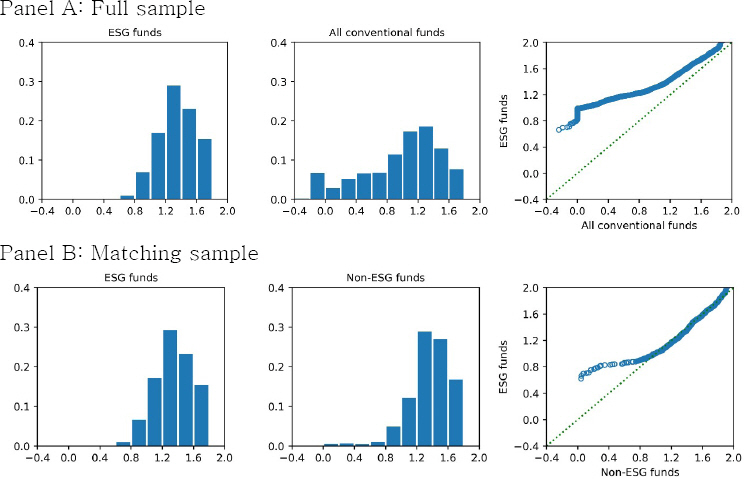
QQ-plots for the ESG Score.
The figure displays the distributions and QQ-plots of ESG scores. Panel A presents the full sample results, and Panel B presents the matching sample results.
<Table 1> presents the summary statistics for ESG and non-ESG funds. We find that ESG funds have significantly higher ESG, E, S, and G scores than non-ESG funds, even when the matching is based on ESG scores. This result is consistent with our premise that ESG funds preserve their sustainability objective. The average raw returns of ESG funds are not statistically different from those of conventional funds. However, the average alphas of ESG funds are significantly lower than those of non-ESG funds. The average ESG fund size is 35 billion KRW, which is much larger than that of non-ESG funds. The average age of ESG funds is 9 years, which is similar to that of non-ESG funds. Furthermore, ESG funds exhibit a lower R-square and a smaller number of stocks are included in the portfolio, implying that they are more selective and hold a less diversified portfolio than conventional funds.

Summary Statistics
This table presents the summary statistics of ESG and matched conventional funds (non-ESG funds). The fund variables included ESG score, raw return, CAPM alpha, Fama and French’s (1993) three-factor alpha, Carhart’s (1997) four-factor alpha, flow, TNA, age, volatility, turnover, R-square, expense, and number of stocks. The last column indicates the difference in the mean value between ESG and non-ESG funds. ***, **, and * indicate significance at the 10%, 5%, and 1% levels, respectively.
4. Empirical Results
4.1 ESG Score and Fund Characteristics
We first examine the influence of fund characteristics on the ESG score of both ESG and non-ESG funds, using the following regression model:
where ESG scorei,t is the ESG (E, S, and G) score for fund i in month t. D(ESG)i is a dummy variable equal to one if fund i is an ESG fund, and zero otherwise. The control variables include return, flow, size, age, return volatility, turnover, R-square, expenses, and the number of stocks.8) The regressions include the year dummy; the standard errors are adjusted for clustering at the fund level.
<Table 2> examines the influence of fund characteristics on ESG scores. The first four columns show the results of Equation (3) for all the funds analyzed. Consistent with the results in <Table 1>, the ESG score is significantly higher for ESG funds than conventional funds. Moreover, ESG funds present a greater consideration of sub-category (environmental, social, and governance) issues separately. We also find some commonalities among funds that influence fund ESG scores. In general, funds with lower flow, lower volatility, lower turnover, higher R-square, and a smaller number of stocks present higher ESG scores. Moreover, funds with high expense ratios generally exhibit higher ESG scores, indicating that ESG investing requires greater ESG information costs. However, the relationship between expense and ESG score becomes negative for the ESG fund sample, possibly benefiting from the accumulated ESG information.

ESG Scores and Fund Characteristics
This table presents the results from regressing the ESG score on the following fund characteristics: ESG dummy, raw return, flow, size, age, volatility, turnover, R-square, expense, and the number of stocks. The regressions include year dummy variables. t-statistics based on standard errors clustered at the fund level are reported in parentheses. ***, **, and * indicate significance at the 10%, 5%, and 1% levels, respectively.
Next, we investigate the relationship between fund ESG scores and factor loading. El Ghoul and Karoui (2017) show that SRI funds with high scores generally have a significant exposure to small beta, large capitalization, growth, and contrarian stocks. Similarly, we estimate Carhart’s (1997) factor loadings using Equation (2) and regress the fund ESG score on the factor loadings. <Table 3> shows the regression results. Unlike El Ghoul and Karoui (2017), ESG funds with high ESG scores do not have a significant exposure to low beta stocks, whereas non-ESG funds with high ESG scores have higher exposure to high beta stocks. For both ESG and non-ESG funds, the ESG score is significantly related to size factors. In other words, a high fund ESG score indicates a significant exposure to large-capitalization stocks. Unlike matched conventional funds, ESG funds with high ESG scores have a greater exposure to value stocks. Among the control variables, ESG funds with a smaller size, older age, and lower expenses tend to have higher ESG scores.

ESG Scores and Fund Factor Loadings
This table reports the results of regressing the ESG score on Carhart’s (1997) factor loadings and the following control variables: flow, size, age, volatility, turnover, R-square, expense, and the number of stocks. The regressions include year dummy variables. t -statistics based on standard errors clustered at the fund level are reported in parentheses. ***, **, and * indicate significance at the 10%, 5%, and 1% levels, respectively.
Overall, our findings so far reveal that ESG funds share common features with non-ESG funds, based on their fund attributes. However, ESG funds preserve their ESG identity because they tilt toward a better ESG portfolio than conventional funds.
4.2 Fund Flow-return Relationship
In mutual fund literature, past performance is one of the most important determinants of fund flows (Chevalier and Ellison, 1997; Sirri and Tufano, 1998; Del Guercio and Tkac, 2002). However, ESG investors may drive their utility primarily from non-pecuniary attributes and, thus, are less sensitive to past performance (Benson and Humphrey, 2008; Bollen, 2007; Renneboog et al., 2011; Riedl and Smeets, 2017). To examine the fund flow-performance relationship, we estimate the following regression model:
where Flowi,t is the flow of fund i in month t. D(ESG)i is a dummy variable equal to one if fund i is an ESG fund, and zero otherwise. Returni,t-1 is the average monthly return of fund i over the months t−12 to t−1, and R+ and R− are indicator variables equal to one if Returni,t-1 is non-negative or negative, respectively. Controlsi,t-1 is a vector of control variables, including flow, size, age, return volatility, turnover, R-square, expenses, and the number of stocks. The regressions include the year dummy; the standard errors are adjusted for clustering at the fund level.
<Table 4> shows the regression results. First, fund flows are sensitive to past returns. In the first column, using raw returns, the coefficient of R+ ×Return is 1.032 (t-statistic = 4.18) and statistically significant, implying that fund flow is sensitive to positive past returns. However, fund flows are not significantly responsive to negative past returns. When we replace raw returns with alphas based on CAPM, Fama and French’s (1993) three-factor model, and Carhart’s (1997) four-factor model, we find that fund flows are positively associated with both positive and negative past performance. Second, in all specifications, we find that the flow-performance sensitivity is not statistically different from that of conventional funds. For example, in the first column, the coefficients of R+×Return×D(ESG) and R-×Return×D(ESG) are 0.187 and -0.050, respectively, but both are statistically insignificant.
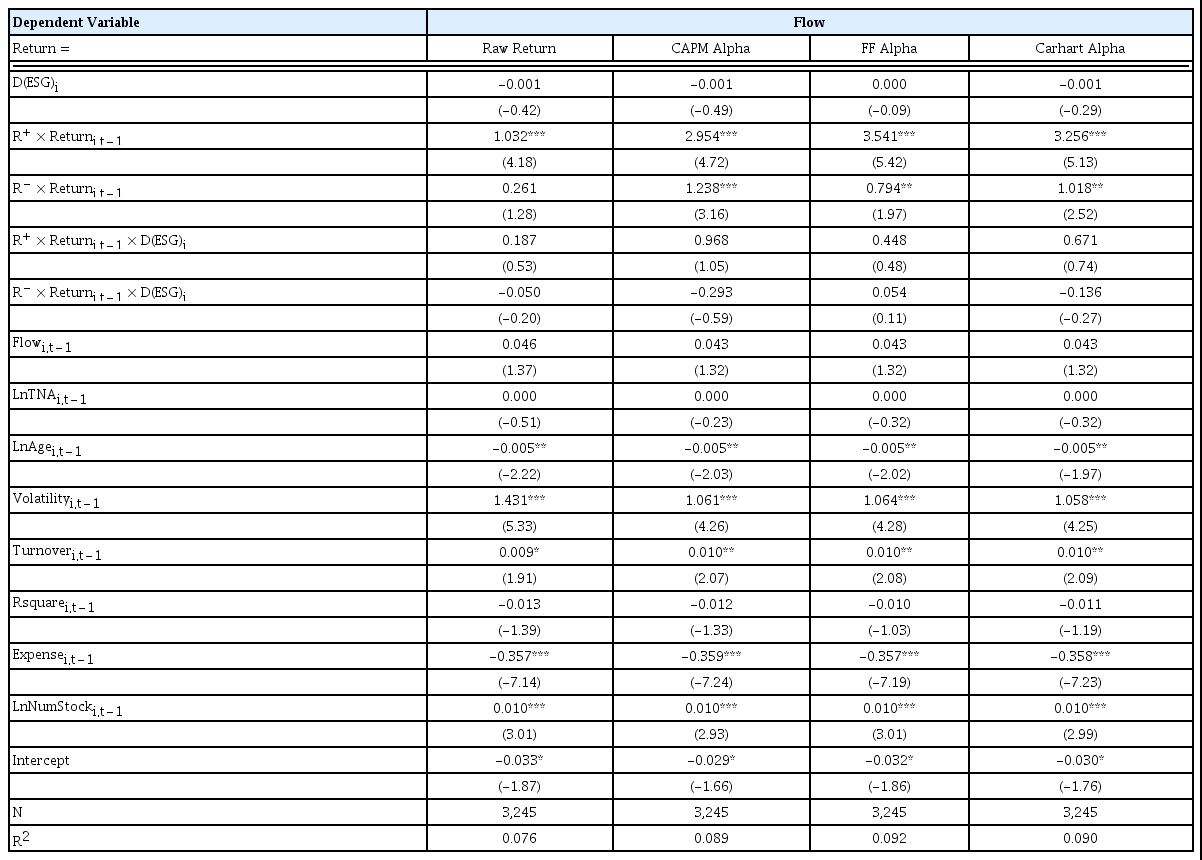
Flow-return Relationship and ESG Fund
This table presents the flow-return sensitivity. The dependent variable Flowi,t is the flow of fund i in month t. D(ESG)i is a dummy variable equal to one if fund i is an ESG fund. Returni,t-1 is the raw return, the CAPM alpha, the Fama and French’s (1993) three-factor alpha, or the Carhart’s (1997) four-factor alpha over the previous 12 months depending on the specifications. R+ and R- are indicator variables that equal one if the average raw return is non-negative or negative, respectively. The control variables are return, flow, size, age, volatility, turnover, R-square, expenses, and the number of stocks. The regressions include year dummy variables. t -statistics based on standard errors clustered at the fund level are reported in parentheses. ***, **, and * indicate significance at the 10%, 5%, and 1% levels, respectively.
<Table 5> further examines whether the flow-return sensitivity is affected by the holdings-based measure of the ESG score. The regression model specification is the same as that of Equation (4), except for the introduction of the ESG dummy variable D(ESG) i,t-1High, which is a dummy variable equal to one if an ESG fund has a higher ESG score than the median value for each month t-1, or zero otherwise. The first column reports that the coefficient of R+×Return×D(ESG)High is -0.781 (t-statistic = -1.92) and significant at the 10% level. The results are robust to using individual E and S scores in the second and third columns, respectively. These findings imply that the flow-performance relationship may depend on the level of ESG attributes. ESG funds with higher scores significantly weaken the flow-performance sensitivity.

Flow–return Relationship with high ESG Scores
This table presents the flow–return sensitivity. The dependent variable flowi,t is the flow of fund i in month t. D(ESG)Highi,t−1 is a dummy variable equal to one if an ESG fund has a higher ESG score than the median value for each month t -1, and zero otherwise. Returni,t−1 is the average raw return of fund i over months t -12 to t -1, and R+ and R− and are indicator variables that equal one if the average raw return is non-negative or negative, respectively. The control variables are return, flow, size, age, volatility, turnover, R-square, expenses, and the number of stocks. The regressions include year dummy variables. t -statistics based on standard errors clustered at the fund level are reported in parentheses. ***, **, and * indicate significance at the 10%, 5%, and 1% levels, respectively.
4.3 Fund Performance
To examine the risk and return characteristics of ESG and non-ESG funds, we test the performance of ESG and non-ESG funds using the monthly returns of an equally weighted portfolio of funds based on the CAPM, Fama and French’s (1993) three-factor model, and Carhart’s (1997) four-factor model. <Table 6> presents the alpha and factor loadings of ESG and non-ESG fund portfolios. The estimates of the alphas are annualized for the presentation. The results show that the alphas for the ESG funds are not significantly different from those of non-ESG funds. Taking Carhart’s (1997) four-factor alpha as an example, the ESG funds are observed to have an average risk-adjusted return of -1.050%, whereas the non-ESG funds have an average return of -0.726%. The difference in alphas between the ESG and non-ESG funds is -0.323% but statistically insignificant, which is consistent with Renneboog et al. (2008, 2011). Among the factor loadings, we find that ESG funds are significantly exposed to market risk and invest relatively more in high-beta stocks than in matched conventional funds.

Fund Performance and Factor Loadings
This table presents the returns of the equally weighted portfolios of ESG and non-ESG funds based on the CAPM, the Fama and French’s (1993) three-factor model, and the Carhart’s (1997) four-factor model. Difference is a portfolio constructed by subtracting non-ESG from ESG fund returns. The alphas’ estimates are annualized for the presentation. t -statistics are computed with Newey and West (1987) standard errors and are reported in parentheses. ***, **, and * indicate significance at the 10%, 5%, and 1% levels, respectively.
To examine the determinants of the future fund performance for ESG and non-ESG funds, we use the following regression model:
where Alphai,t is the average abnormal return estimated from CAPM, Fama and French’s (1993) three-factor model, and Carhart’s (1997) four-factor model over the previous 12 months. ESG scorei,t-1 indicates the fund ESG score for fund i in month t-1. Controlsi,t-1 are the same as in Equation (3). The regressions include the year dummy; the standard errors are adjusted for clustering at the fund level.
Panel A in <Table 7> presents the regression results with different asset pricing models. For ESG funds, we find that the ESG attributes are negatively associated with future performance. In the first column, based on the CAPM alpha, the coefficient of ESG score is -0.154 (t-statistic = -4.35), which is statistically significant at the 1% level. The coefficients are also statistically significant when using alphas based on Fama and French’s (1993) three-factor model and Carhart’s (1997) four-factor model. However, this is not the case for the matched conventional funds, as the coefficient of is statistically insignificant under all specifications. These findings are consistent with the notion that the ESG screening process may constrain the investment universe, thus decreasing future performance (El Ghoul and Karoui, 2017; Renneboog et al., 2008, 2011). Unlike non-ESG funds, the coefficients of LnTNA and LnAge are significantly negative. These results suggest that larger and older ESG funds are more likely to undergo intensive screening and thus significantly underperform with regard to the matched conventional funds. Moreover, the coefficient of LnNumStock is significantly positive, further supporting the notion that ESG screens narrow the investment universe and decrease future performance. Panel B further reports the results of ESG funds based on the ESG sub-category using the Carhart alpha. The coefficients of E score and S score are negative and statistically significant at the 1% level. However, the coefficient result of the G score is not statistically significant, suggesting that the screening intensity of governance factor in the case of ESG fund is relatively low compared to the environmental or social factors.

Determinants of Fund Future Performance
This table presents the estimates of the determinants of future performance. The dependent variable Alphai,t is the abnormal return estimated from the CAPM, the Fama and French’s (1993) three-factor model, or the Carhart’s (1997) four-factor model over the previous 12 months. The control variables are return, flow, size, age, fund return volatility, turnover, R-square, expenses, and the number of stocks. The regressions include year dummy variables. t -statistics based on standard errors clustered at the fund level are reported in parentheses. ***, **, and * indicate significance at the 10%, 5%, and 1% levels, respectively.
Panel A: Based on different asset pricing model
The “smart money” effect (Gruber, 1996; Zheng, 1999; Muñoz, 2019) indicates that investors can select mutual funds to generate higher future returns. To further test whether ESG investors are financially smart (Renneboog et al., 2011), we use the following regression:
where Alphai,t is the average abnormal return estimated from Carhart’s (1997) four-factor model over the previous 12 months. D(ESG)i and Controlsi,t-1 are defined using Equation (3). Column (1) in <Table 8>, based on the CAPM alpha, shows that fund flows are positively related to future fund performance for all sample funds (Muñoz, 2019; Yoo and Kim, 2012). However, we find no evidence to support that ESG fund investors have better selection skills than non-ESG fund investors. As shown in Column (2), the coefficient of the interaction term between Flow and D(ESG) is insignificant. In Columns (3) to (6), the results are robust with the alphas based on Fama and French’s (1993) three-factor model and Carhart’s (1997) four-factor model. These results suggest that ESG fund investors’ fund-selection skills are not significantly different from those of non-ESG fund investors.
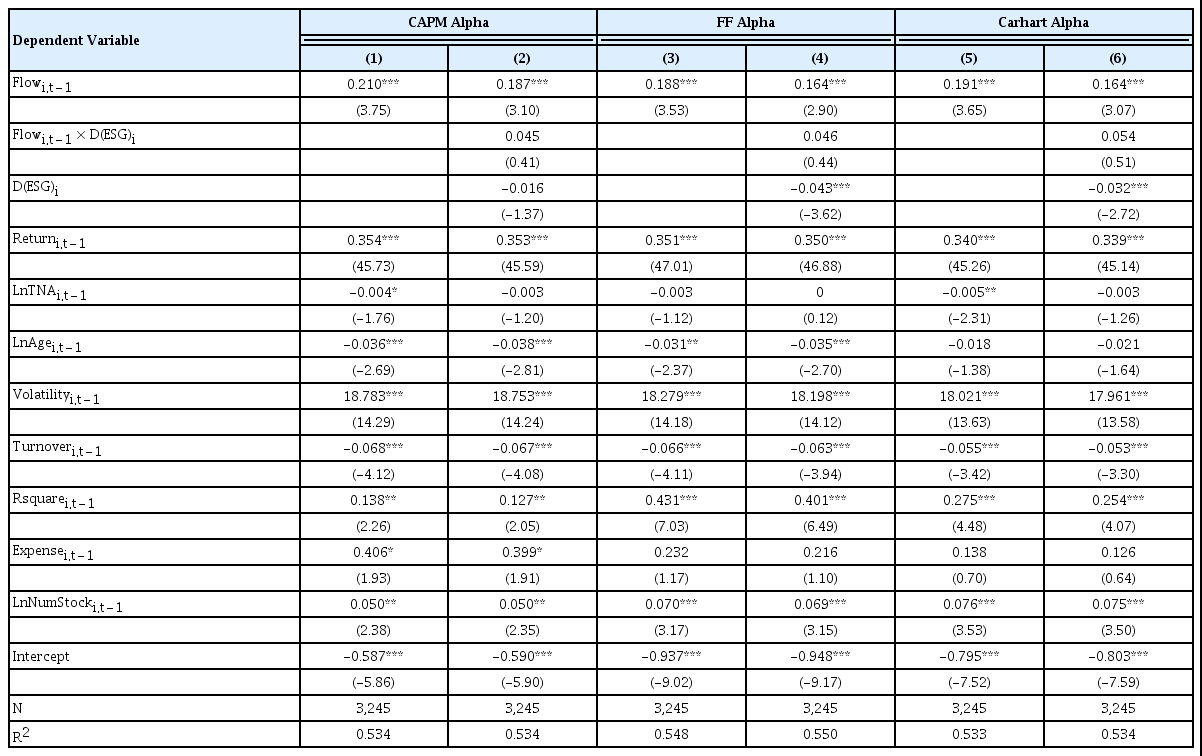
Smart Money Effect
This table presents the results for the smart money effect. The dependent variable Alphai is the abnormal return estimated from the CAPM, the Fama and French’s (1993) three-factor model, or the Carhart’s (1997) four-factor model. The alphas and returns are converted from decimals to percentages for regression. D(ESG)i is a dummy variable equal to one if fund is an ESG fund. The control variables include return, flow, size, age, fund return volatility, turnover, R-square, expenses, and the number of stocks. The regressions include year dummy variables. t -statistics based on standard errors clustered at the fund level are reported in parentheses. ***, **, and * indicate significance at the 10%, 5%, and 1% levels, respectively.
5. Conclusion
This study uses Korean active mutual fund data and investigates whether ESG funds have distinct features compared to those of conventional funds, based on fund-level ESG scores using portfolio holdings, flows, and performance. The empirical results show that ESG funds share common features with non-ESG funds, based on their fund attributes and factor loadings. However, ESG funds preserve their ESG identity because they tilt toward better ESG portfolio holdings than non-ESG funds. ESG funds with higher scores significantly weaken flow-performance sensitivity and are negatively associated with future performance.
This study contributes to the literature by providing a comprehensive analysis of ESG funds in Korea. We show that the true identity of ESG funds depends on ESG attributes (i.e., higher fund ESG scores), which are determined by ESG fund labels. Further, by providing evidence of ESG fund holdings and performance, this study can help investors to undertake better decisions. It would be fruitful for future studies to examine cross-sectional variations in ESG screens, strategies, or fund managerial features specified in the fund prospectus and explore how those variables affect ESG fund flows and performance. Since 2020, several ESG funds have changed their names including the words “sustainable,” “impact,” or “green.” Future studies could investigate whether ESG funds become more sustainable after name changes (El Ghoul and Karoui, 2021).
References
Notes
This study uses sustainable investing, socially responsible investing (SRI), and ESG investing interchangeably to include a wide spectrum of investing goals considering both financial returns and social returns.
Please see the Sustinvest (2021).
The KCGS has been publishing ESG ratings in October every year. In the early years, however, it did not have a fixed schedule in this regard. For example, it published ESG ratings in June in 2012 and in October in 2013.
For the robustness of our empirical study, we use various asset pricing models. Kim et al. (2012) show that Fama and French’s (1993) three-factor model performs satisfactorily among the asset pricing models considered in explaining the cross-sectional behavior of stock returns in Korea. Carhart’s (1997) four-factor model is commonly used in the mutual fund literature (Cremers et al., 2019).
We construct the momentum factor using six value-weighted portfolios formed on size and the average return over the previous 12 months. Specifically, the portfolios, which are rebalanced monthly, are based on the intersections of two portfolios that are formed on size (S and B) and three portfolios that are formed on momentum (W and L). The size breakpoint is the 50th percentile of all the companies in the sample. The momentum breakpoints correspond with the 30th and 70th percentiles. The momentum factor (WML) is defined as the average return on the two winner portfolios minus the average return on the two loser portfolios, that is, WML = 1/2 (SW + BW) - 1/2 (SL + BL).
Our main empirical results remain unchanged when we verify ESG funds based on the Morningstar list.
The logit model regresses dummy variables indicating whether a fund is an ESG fund or not based on the fund’s characteristics as follows: Prob(SRI = 1) = f (βX), where X is a vector of firm’s ESG score, size, age, the Carhart’s (1997) alpha, expense ratio, turnover, and the number of stocks, and β is a vector of the corresponding coefficients. Propensity scores are the fitted values from this model and can be interpreted as the probability of being ESG funds.
Although we include fund common characteristics in the matching procedure, some variables, i.e., size, still show the statistical difference between ESG and non-ESG funds (see <Table 1>). We thus control for the fund characteristics in the main regression to rule out any potential influence on our results.