지배주주는 언제 과잉투자하는가? 상품시장에서의 경쟁의 규율효과
When Do Controlling Shareholders “Over-invest”? The Disciplinary Effect of Product Market Competition
Article information
Abstract
본 연구는 한국 기업을 대상으로 지배주주 지분과 상품시장에서의 경쟁 간 상호작용이 투자 비효율성에 미치는 영향을 실증적으로 확인한다. 분석결과, 대리인이론의 예측과 같게, 지배주주가 낮은 지분을 보유할수록 기업의 과잉 투자성향이 확대되는 것으로 관찰된다. 다만, 이러한 관계는 경쟁 위협이 부재한 비경쟁적인 상품시장에서 확인되지만, 경쟁적인 상품시장에서 사라진다. 이는 경쟁이 지배주주의 과잉투자 유인을 사전에 규율하기 때문으로 해석된다. 본 연구는 집중된 소유구조 특성을 갖는 신흥국가에서 기존 대리인이론을 확장하여 경영 통제장치로써 상품시장에서의 경쟁이 갖는 규율효과의 경로를 확인하는 학술적 시사점을 갖는다.
Trans Abstract
This study examines the effect of the interaction between controlling shareholder ownership and product market competition on investment inefficiency in Korea. Consistent with classical agency theory, this study finds that the lower the controlling shareholder ownership, the greater the overinvestment. However, this relationship strengthens in non-competitive markets but disappears in competitive markets. This suggests that product market competition has a disciplinary effect on the incentive of controlling shareholders to pursue private benefits. This study has implications for the disciplinary effect of competition and expands the literature on agency theory in emerging countries with concentrated ownership structures.
1. Introduction
In classical agency theory, the managerial ownership of a firm is a factor that has considerable influence on corporate decision-making, as it is closely related to managers’ incentives (Jensen and Meckling, 1976; La Porta et al., 1999). The utility of managers is proportional to the combination of monetary compensation and private benefits (Fama, 1980; Burkart et al., 2003). Ownership is an important factor for managers in determining whether they find monetary compensation or private benefits more valuable. As the pursuit of private benefits is accompanied by a decline in firm value (i.e., monetary compensation), it is hard to find a decision that increases both of them. Therefore, the managers will choose one to maximize their utility under the given constraints. The importance of ownership is more emphasized in emerging economies where most firms have controlling shareholders. Controlling shareholders (namely, owner-managers)1), with de facto control rights over corporate management can make arbitrary decision-makings to maximize their utility (Almeida et al., 2011). Accordingly, many previous studies on emerging economies focus on the agency problem based on the ownership of controlling shareholders (Shleifer and Vishny, 1997; La Porta et al., 1999).
Some studies argue that managerial incentives based on ownership can be affected by various firm characteristics and external environmental factors. Stulz (1988) argues that as managerial ownership increases, the firm value rises to a certain level, but then decreases. He suggests that the decrease in firm value is attributable to managerial slack; managers with more than 50% ownership can avoid the threat of M&A. Morck et al. (1988) show a cubic relationship between managerial ownership and firm value. As a cause of this relationship, they identify the operation of possible market discipline mechanisms, such as the market for corporate control, managerial labor market, and product market competition. These discussions suggest that managerial ownership and agency problems may not have a simple linear relationship and that another factor could influence this relationship. In a similar context, recent studies in the field of corporate governance suggest that agency problems should be controlled by the interactions between various mechanisms, rather than a “one-size-fits-all” solution (Shleifer and Vishny, 1997; Giroud and Mueller, 2011; Kim and Lu, 2011).
This study examines the relationship between controlling shareholders’ ownership and investment inefficiency in emerging economies, and more importantly, how product market competition affects this relationship. We focus on investment inefficiency because it is directly related to the fundamental task of financial theory; that is, the efficient allocation of corporate resources (Stein, 2003). Notably, investment decision-making can be closely linked to the agency problem. Managers may create over- or under-investment problems by distorting investment expenditures to increase their monetary compensation or private benefits (Jensen, 1986). Inevitably, the ownership structure reflecting the managers’ utility can be closely related to these inefficient behaviors (Jensen and Meckling, 1976; Smith and Stulz, 1985; Gutierrez and Philippon, 2018). These behaviors can undermine the wealth of other shareholders by incurring unnecessary investment costs and losing inherent growth opportunities.
Product market competition can be understood as an essential prerequisite to consider in verifying agency theory and other corporate finance theories because it is an environmental factor that all firms must face. There are conflicting views on the effects of competition on managerial incentives. On the one hand, agency theory argues that competition is an external control mechanism and helps to effectively discipline managers’ incentives to pursue private benefits (Fama, 1980; Shleifer and Vishny, 1997; Giroud and Mueller, 2011; Kim and Lu, 2011). More specifically, competition has the disciplinary effect of alleviating information asymmetry and increasing the bankruptcy risk (Hart, 1983; Holmstrom, 1982; Schmidt, 1997). On the other hand, another line of literature suggests that competitive pressures can reduce the profitability of firms, thereby weakening the managers’ incentive to increase the monetary compensation proportional to their ownership (Schmidt, 1997; Raith, 2003). In this case, managers in competitive industries may prefer to maximize their utility by pursuing private benefits.
The sample of the empirical analysis in this study consists of firms listed on the Korea Exchange (KRX) for several reasons. First, we focus on the Korean capital market because Korea is a representative emerging country and has concentrated ownership structures. Claessens et al. (2000) analyze the characteristics of ownership structures of East Asian countries and find that controlling shareholders exist in about 76.7% of Korean firms, which is above the average. Moreover, they find that in about 80.7% of Korean firms, the controlling shareholders’ families hold the position of CEO or Chairperson of the board of directors. By analyzing Korean firms, this study can present strong empirical evidence of the incentive of managers with substantial ownership. Second, many studies observe tunneling phenomena in Korea, and a typical path to this phenomenon is arbitrary investment decisions by controlling shareholders. Bae et al. (2002) suggest that the controlling shareholders in Korea’s business groups pursue private benefits by maximizing the group size through indiscriminate M&A, by which they decrease the wealth of minority shareholders. Joh (2003) points out that the excessive investment propensity of controlling shareholders is a main cause of the economic crisis.
In the regression analysis using all firms listed on the KRX from 2005 to 2016, we find that the ownership of controlling shareholders has a significant negative (-) effect on investment inefficiency. This means overinvestment in low ownership cases and underinvestment in high ownership cases, consistent with expectations in theoretical studies (Jensen and Meckling, 1976; Jensen, 1986; Fama and Jensen, 1983; Holmstrom, 1979; Smith and Stulz, 1985). However, as a result of decomposing the investment inefficiency into overinvestment and underinvestment, we find a significant negative (-) effect only in overinvestment. On the other hand, this influence varies with the level of product market competition; that is, it disappears in competitive product markets but is observed only in non-competitive product markets. This result implies that competitive threats preemptively constrain controlling shareholders’ incentives to pursue private benefits. Additionally, we observe these results mainly in firms with high market power and high agency cost. This finding implies that the agency problem, not the necessity for aggressive investment spending by firms lacking market power, leads to our results.
Our results have two academic contributions. First, we can contribute to the understanding of how product market competition disciplines the agency problem in emerging countries. As existing studies on the disciplinary effect of competition focus on developed countries (Giroud and Mueller, 2011; Laksmana and Yang, 2015), we could not generalize the effect to countries with different legal systems and market environments. This study may imply to confirm that the disciplinary function of the competition can control the agency problem of controlling shareholders, which is the main source of inefficiency in the capital markets of the emerging economies. Second, we can contribute to the generalization of agency theory by expanding and supplementing it. As existing studies propose, if the controlling shareholders pursue private benefits based on their ownership, then these firms will have to be excluded from the capital market by being turned away from investors in the long term. However, these firms still exist, suggesting that classical agency theory has limitations in effectively explaining the reality of capital markets. The results of this study imply that competition may moderate the influence of ownership structure.
The rest of this paper is structured as follows. In section 2, we develop our hypotheses based on a discussion of previous theoretical and empirical studies. Section 3 describes the data and variables. Section 4 reports the empirical results, and section 5 presents our conclusions.
2. Background and Hypothesis Development
2.1 Managerial Ownership and Investment Inefficiency
The optimal investment decision is a fundamental research topic in financial theory as a prerequisite for achieving efficient corporate resource allocation. However, this decision may be closely related to the agency problem (Stein, 2003). Managerial ownership can be a mechanism to solve this problem. For example, an increase in managers’ ownership strengthens their incentives to maximize monetary compensation by improving firm value and weakens their incentives for private benefits. Therefore, it can lead to optimal managerial decision-making. From this perspective, existing theoretical and empirical studies focus on the relationship between managerial ownership and investment decisions.
2.1.1 Overinvestment
Jensen and Meckling (1976) and Jensen (1986) argue that private benefits of managers are proportional to the firm size. Increasing the size of the firm enhances managers’ reputations in the capital market and increases their discretion over corporate resources. Thus, managers have an incentive to overinvest. This behavior is more likely to occur in firms with small or no ownership of managers because they can enjoy the private benefits while transferring the associated costs and risks to shareholders. Shin and Park (1999) point out that controlling shareholders in Korean ‘chaebols’ have significant control power over all affiliates with only small ownership, and such excessive control can lead to overinvestment. Joh (2003) argues that the disparity between control rights and cash flow rights in Korean firms is one of the causes of the Asian financial crisis, and shows that the overinvestment in other affiliates of the same business group is the main route that weakened firms’ profitability. Jiang et al. (2011) analyze the relationship between the ownership-control disparity and investment-q sensitivity (the sensitivity of investment expenditure to growth opportunities) in East Asian and European countries. Based on the negative (-) relationship, they suggest that overinvestment could occur when the owner-managers exercise excessive control rights with small cash flow rights. Considering the above arguments and findings, if controlling shareholders possess low ownership, then maximizing their utility through pursuing private benefits becomes optimal, and thus overinvestment will increase. On the other hand, if they hold high ownership, then overinvestment is less likely to occur, as controlling shareholders must bear the associated investment costs and potential losses (risks).
Hypothesis 1-1: Controlling shareholders’ ownership will have a negative (-) influence on overinvestment.
2.1.2 Underinvestment
The agency problem based on the ownership structure could also be associated with underinvestment caused by excessive risk aversion (Fama and Jensen, 1983).2), Holmstrom (1979) argues that the higher the sensitivity between managers’ monetary compensation and the firm’s performance, the higher the managers’ risk aversion tendency because they have to bear the potential investment losses on his own. Smith and Stulz (1985) suggest that managers with high ownership are more likely to use derivatives or diversify corporate investments for risk aversion. Stulz (1988) argues that managerial ownership beyond a certain threshold can strengthen entrenchment behavior, and thus lead to a decline in firm value. Faccio et al. (2011) suggest that firms with shareholders who find it difficult to diversify their investment portfolios are more likely to be risk-averse. Underinvestment3), due to risk aversion can limit the opportunities for creating future profits, thereby undermining minority shareholders’ wealth (Kim and Lu, 2011). Based on these arguments and findings, we expect that the probability of underinvestment increases as controlling shareholders’ ownership increases.
Hypothesis 1-2: Controlling shareholders’ ownership will have a positive (+) influence on underinvestment.
2.2 Product Market Competition and Managerial Incentives
The industrial organization field emphasizes that product market competition has a considerable influence on managers’ decision-making (Tirole, 1988). In this context, prior studies on corporate finance show that competition has a significant impact on financial decisions, such as dividend payment, capital costs, capital structure, and investments (La Porta et al., 2000; Valta, 2012; Xu, 2012; Laksmana and Yang, 2015). Competition is important as it is an exogenous factor that managers cannot control, and precedes internal management decisions. Naturally, we expect that controlling shareholders will consider the level of competitive pressures in the process of exercising their control.
There are several studies that verified the effect of product market competition in Korea. Lee and Byun (2016a) report that the risk-seeking propensity of firms is reduced in a competitive market. On the other hand, Cho and Choi (2016) show that overinvestment increases in a competitive market. One explanation for this is that the incentive to disclose information can be reduced due to the threat of competition. There are studies focusing on the interaction between the ownership structure of controlling shareholders and the competitive threat. Lee and Byun (2016b) present that the negative influence of the ownership-control disparity of controlling shareholders on firm value is observed only in the non-competitive market. This means that the incentives of controlling shareholders to pursue private benefits can be controlled through the threat of competition. Lee and Byun (2015) suggest that companies with low controlling shareholders’ ownership have a high risk-taking propensity, but this effect is only observed in non-competitive markets. Byun et al. (2012) analyze the influence of the interaction between corporate governance and competition on firm value. They report that the positive influence of governance on firm value is observed only in non-competitive markets. Based on this result, they argue that there is a substitute relationship between corporate governance and competition to discipline the agency problem. Byun et al. (2018) analyze the effect of competition on the ownership-control disparity of controlling shareholders in Korean chaebol business groups. They report that the ownership-control disparity is low in a competitive market. This suggests that the competitive threat controls the incentives of controlling shareholders to pursue private interests in advance. However, our study differs from their study in that it evaluates the relevance of overinvestment as a specific path to the pursuit of private interests.
Park et al. (2011) report an increase in dividends and share repurchase while investment decreases in firms with good governance in a non-competitive market. This suggests that good corporate governance mainly controls overinvestment, as the agency problem is more likely in the absence of the disciplinary effect of competition. This discussion is consistent with the argument of this study. However, this study attempts a precise approach using the ownership structure that more clearly reflects the incentives of controlling shareholders to pursue private interests. In addition, we present a more realistic hypothesis that considers not only the disciplinary effect of competition but also the incentive effect linked to monetary rewards. By simultaneously considering the bidirectional effects of competition, we will expand the generalizability of the hypothesis. Finally, unlike previous studies using the amount of investment, we try to take a more rigorous approach by estimating the level of overinvestment.
2.2.1 Private Benefits
Many theoretical and empirical studies focus on the disciplinary effect of product market competition as an external control mechanism. Previous studies find that competition can discipline the agency problem. Hart (1983) argues that managers under competitive pressure will try to reduce costs to reach the profit target to maintain their positions rather than manage the firm negligently, and thus improving management efficiency. Schmidt (1997) argues that competition has the effect of maximizing managerial effort by expanding the distress risks (threat-of-liquidation effect). Managers who care about their reputations, monetary compensation, and positions will make the optimal managerial decisions to minimize the distress risks. Holmstrom (1982) finds that relative performance evaluation can reveal information on managerial behaviors that are difficult to infer from the firm’s absolute performance. This evaluation can be effectively made in competitive markets where it is easy to compare firms (Nalebuff and Stiglitz, 1983). That is, evaluating performance through comparison with many competitors has the effect of eliminating some common factors, which makes it easier to evaluate managers’ true abilities effectively. Guadalupe and Pérez-González (2010) find empirically that the magnitude of managers’ private benefits measured by the control premium is low in competitive markets.
In light of this prior research, we expect the relationship between controlling shareholders’ ownership and investment inefficiency to diminish or disappear if their incentives to pursue private benefits are controlled in advance due to the disciplinary effect of product market competition. Excessive investment spending (i.e., overinvestment) in competitive markets can result in economic loss or failure to secure competitive advantage, increasing the possibility of bankruptcy. In the case of bankruptcy, the controlling shareholder must bear not only the explicit loss of diminishing discretion but also the implicit loss of decline in reputation. Meanwhile, the internal information such as capital availability and growth opportunities of firms in competitive markets can be easily recognized by investors by comparing it with many competitors. In this circumstance, if the controlling shareholder excessively avoids risk (i.e., underinvestment), then disciplinary pressure, such as a demand for greater dividends and the threat of management change by the various stakeholders, will increase. In sum, controlling shareholders’ pursuit of private benefits in competitive product markets will incur too many potential costs to themselves. Therefore, they will recognize to improve the management efficiency to secure competitive advantage as the optimal decision. As a result of this decision, controlling shareholders with small or no ownership can seek to enhance their reputations and maintain their positions, and those with large ownership can maximize their utility by improving the firm value. On the other hand, in non-competitive markets in which the disciplinary effect is relatively absent, controlling shareholders will perceive pursuing private benefits as a rational choice.
Hypothesis 2-1: The relationship between the controlling shareholders’ ownership and investment inefficiency will decrease or disappear in competitive product markets and will be observed mainly in non-competitive product markets.
2.2.2 Monetary Compensation
Unlike the above perspective, competitive pressure can be a factor that hinders efficient corporate decision-making. Some studies suggest that low profitability in competitive markets can weaken managers’ monetary incentives. Schmidt (1997) suggests that in competitive markets where the marginal profits converge to the marginal costs, it is difficult for managers to extend their monetary compensation by improving firm value or profitability, even if they make the best effort. Raith (2003) argues that if firms are free to enter the market, incoming competitors with low prices in competitive markets could reduce the marginal benefits of cost reduction through efficient management. Hermalin (1992) and Scharfstein (1988) argue that in competitive markets with low marginal profits, managers can establish more aggressive investment portfolios to expand their monetary compensation.
In competitive markets, controlling shareholders will expect low monetary compensation, and will instead pursue private benefits by overinvestment to maximize their utility. Especially, controlling shareholders with small or no ownership, who have little to lose even if the investment ends in failure, will choose to overinvest as a kind of betting tool to generate high returns. Meanwhile, it is also possible that underinvestment incentives will be strengthened in competitive markets. The value of the costs saved through best efforts will not be so great due to the high competitive pressure. Therefore, from the perspective of controlling shareholders with large ownership, avoiding risky investments and minimizing the investment costs could be the best decision to prevent a decline in their monetary compensation. Moreover, low profitability and high bankruptcy risk in competitive markets will further strengthen the incentive to underinvest to minimize the potential investment risks. In sum, competitive pressures will weaken the incentive for controlling shareholders to expand monetary compensation, so increasing private benefits by over- or underinvestment will be optimal to maximize their utility. On the other hand, in non-competitive markets, controlling shareholders have an incentive to manage the firm efficiently, as the monetary compensation increases in proportion to the effort.
Hypothesis 2-2: The relationship between controlling shareholders’ ownership and investment inefficiency will be observed mainly in competitive product markets and decrease or disappear in non-competitive product markets.
3. Data and Variables
3.1 Data
Our initial sample consists of listed firms on the KRX from 2005 to 2016. Considering the comparability of financial statements and different regulations, we exclude finance and insurance firms, as well as firms with impaired capital. The final sample for which we can access the data consist of 763 firms (7,440 firm-year observations, unbalanced panel data). We compile the ownership structures manually from the annual reports. We collect the financial, accounting, and stock price data from FN-Guide database. To measure product market competition, we use the Korea Standard Industry Code (KSIC) to identify the industry.
3.2 Variables
3.2.1 Investment Inefficiency
We estimate investment inefficiency based on Richardson’s (2006) measure. To measure investment inefficiency, McNichols and Stubben (2008) use Tobin’s Q and cash flow, and Biddle et al. (2009) use the sales growth rate. However, estimating these measures requires a high number of observations (e.g., more than 20) in a specific industry. This requirement naturally excludes monopoly or oligopoly industries. On the other hand, Richardson (2006) does not limit the number of firms to measure investment inefficiency, which enables us to focus on the difference in product market competition.
Richardson (2006) measures investment inefficiency based on equation (1). Investments that are not related to firm characteristics such as growth opportunities, capital structure, and cash holdings are regarded as inefficient investments (over- or underinvestment). We measure Investment as the sum of capital expenditure and R&D expense divided by total assets. We estimate V/P, a proxy for growth opportunity, firm value (V) divided by the market value of equity (P).4), Here, V=(1-αr)BV+α(1+r)X-αrd, α=(ω/(1+r-ω)), r=0.12, and ω=0.62. ω is based on Ohlson’s (1995) abnormal earnings persistence parameter. BV is the book value of common shares, d is dividends, and X is operating income after depreciation. Leverage is total debt divided by total assets and Cash is cash and cash equivalents to total assets. Age is the natural log of the age of the firm, Size is the natural log of total assets, and Stock return is the stock returns for one year. We define the residual of equation (1) as investment inefficiency (Residual).5)
As we explained in the hypotheses development, investment inefficiency based on controlling shareholders’ ownership could be related to both over- and underinvestment. Thus, to rigorously distinguish between these two issues, we use additional variables. As a measure of overinvestment, we set a variable that takes the absolute value if the residual is greater than zero, and a value of zero if the residual is less than zero (Residual Over). As a measure of underinvestment, we set a variable that takes the absolute value if the residual is less than zero, and a value of zero if the residual is greater than zero (Residual Under).
Using the estimated investment inefficiency has a limitation in that we cannot intuitively grasp how much investment expenditure the firm actually spends. Therefore, for a clearer and more direct measure of investment inefficiency, we use industry-adjusted investment expenditure (Excess investment). We calculate this variable as the firm’s investment expenditure minus the average industry investment expenditure, classified based on the 3-digit KSIC.
3.2.2 Ownership6)
We focus on the ownership structure of controlling shareholders, who have actual control rights in the management activities. To obtain the ownership structure of the controlling shareholders, we must select the shareholders who have actual control. The controlling shareholders of Korean firms secure control rights using indirect ownership through affiliates. Thus, the largest shareholder of a firm is frequently an affiliate (corporation) rather than a controlling shareholder. In this case, the largest shareholder’s ownership does not reflect the monetary incentive of the controlling shareholders (individuals). On the other hand, Korean firms are usually controlled by the controlling family and should be regarded as the same economic entity. Considering these characteristics, we first make comprehensive use of the annual reports, reports of changes in the firm’s ownership structure, and newspaper articles to identify the controlling shareholders and their relatives. Next, we manually collect the ownership of the controlling family from the annual reports. We use the sum of the ownership of the controlling family (Controlling ownership) in the empirical analysis.
Controlling shareholders can expand their control rights through indirect ownership through affiliates, pyramid ownership structures, and cross-shareholdings, in addition to direct ownership (cash flow rights). That is, we can define the controlling shareholders’ control rights as the sum of direct and indirect ownership.7), If controlling shareholders exercise excessive control rights relative to their direct ownership, then they could have more incentive to pursue private benefits (Grossman and Hart, 1988). This is because the burden of the decline in the value of shares due to the pursuit of private benefits is relatively small. Therefore, we use the disparity between control rights and cash flow rights as the alternative proxy for the ownership structure of controlling shareholders. Control rights are the sum of direct ownership by the controlling family and the affiliates’ ownership. The cash flow rights are the direct ownership by the controlling family (Disparity).
3.2.3 Product Market Competition
We measure product market competition using the HHI, which is a common measure in the field of industrial organization. HHI is intuitive and easy to understand and is relatively simple to estimate, and therefore suitable for our analysis of many industries. Because of these advantages, many recent corporate governance studies focusing on the disciplinary effect of competition use this index (Giroud and Mueller, 2011; Valta, 2012). To estimate the HHI, we first categorize the sample firms by industry using the KSIC, which is published by Statistics Korea, a central government organization for statistics. Existing studies estimate the competition level based on the 3-digit industry code, considering the comparability between industries (Hou and Robinson, 2006). We use the same criteria. For the robustness check, we additionally use the 2- and 4-digit8), KSICs to measure the HHI.9), Ali et al. (2009) point out that using only listed firms to measure the level of competition may not reflect reality correctly. This problem could be more serious in Korea, as its capital market is less developed. Therefore, we measure the HHI using not only listed firms but also unlisted firms that provide reliable financial data (firms that are subject to external audits).10) We calculate the HHI as the sum of the squares of the market share based on the sales of the firms in the industry (HHI). HHI has a value between 0 and 1. A higher HHI means a concentrated market structure and low competition, while a low HHI implies that there are many firms with small market shares competing in an industry, indicating high competition.
To minimize measurement error, we use additional measures such as the concentration ratio (CR4), entry cost, and price-cost margin. CR4 is the sum of the market share of the top four firms in an industry (CR4). If there is a large deviation in market share among firms in the industry, then competition among firms with a high market share will be intense, while firms with a low market share are more likely not to face competition. We use CR4 to reflect this property (Hou and Robinson, 2006; Giroud and Mueller, 2010). A higher CR4 indicates lower competition.
Competitive pressures can be weighted by not only existing firms in the industry but also by potential entrants. HHI and CR4 have a limitation in that they measure the level of product market competition among only existing firms in the current product market. Li (2010) measures the level of potential competitive threats based on the cost of entry to the industry calculated by taking the natural log of the weighted average tangible assets of firms in the same industry (Entry cost). The weighted average is based on market share. A high level of this indicator means a relatively high entry barrier so that the magnitude of the potential competitive threat is small. The price-cost margin reflects product substitutability based on the industry’s profitability (Bena and Xu, 2017). It is the sum of sales divided by the sum of the cost of sales and selling and administrative expenses (SG&A) of firms in an industry (Price-cost margin) (Karuna, 2007). The higher the price-cost margin is, the higher the monopoly profits compared to the input resources are, meaning that it is a relatively non-competitive market.
3.2.4 Other Variables
To mitigate the potential omitted variable bias, we include various control variables that could influence investment inefficiency in the empirical model (Myers, 1977; Jensen, 1986; Biddle and Hilary, 2006; Richardson, 2006). The size of the firm affects external financing capacity, as it is related to information opacity and collateral capabilities. The more stable the funding capacity, the greater the ability to cover the costs to realize the investment opportunity. Therefore, we add the natural logarithm to the firm’s total assets as a measure of firm size (Size). A high leverage ratio can cause underinvestment problems by increasing the bankruptcy risks (Myers, 1977). In terms of agency theory, a high debt ratio has the effect of preventing the overinvestment problem, as it reduces the free cash flow that managers can use (Jensen, 1986). Taking these effects into account, we include the debt-to-equity ratio in the model (Leverage).
It is possible that the firm’s internal funding capacity reduces due to the low profitability, thereby the ability to spend the expenses associated with the investment may decrease. To control these effects, we include net income to total assets (ROA). The firm chooses the optimal level of investment expenditure to realize growth opportunities and to ensure future sustainability. Even if managers have excessive investment spending from the agency theory perspective, it would be difficult to regard it as overinvestment if the goal is to realize growth opportunities. Thus, to control for growth opportunity, we include the market to book ratio, which we calculate as the market value of equity (the number of common shares*the stock price at the end of the year) divided by its book value (Market-to-book) (Biddle and Hilary, 2006).
Free cash flow represents the internal fund available to the manager, and classical agency theory points out that as it rises, the agency problem can increase (Jensen, 1986; Richardson, 2006). We define free cash flow as operating cash flow minus interest costs, dividends, and corporate taxes, divided by total assets (Free cash flow). To obtain a clearer result for the relationship between the ownership structure of controlling shareholders and their investment decisions, we control the controlling shareholders’ incentive to pursue private benefits unrelated to the ownership structure. Almeida et al. (2011) find that controlling shareholders may adjust discretionary accruals to avoid losses due to declining operating performance, which we can perceive as a typical agency problem. We calculate the discretionary accruals variable as the absolute value of the difference between net income divided by total assets and the operating cash flows divided by total assets (Accruals).
Firms diversify their investment expenditures according to their stage in the life cycle, so we include the natural logarithm of the age of the firm (Age). Dividend payments could be a signal to the stock market of stable profitability, so it may be associated with an increase in future investment expenditures. To control these effects, we add the ratio of cash dividends to equity (Dividend). Corporate growth opportunities can be linked to both future growth potential and current growth levels. As we mentioned earlier, growth opportunities are the most important indicators for assessing the adequacy of corporate investment spending. Therefore, we use the average sales growth for the past three years as a proxy for the current growth level (Sales growth). Lastly, liquid assets represent the size of the accumulated internal resources available to managers in the short term. Firms with larger liquid assets will have greater room to cover the investment costs. We control for this effect including liquid assets divided by total assets (Liquidity).
To reduce the endogeneity problem based on the causal relationship between the ownership of controlling shareholders and investment expenditures, we additionally use a 2-stage least squares (2SLS) model. As an instrument variable, we use the standard deviation of monthly stock returns on the ownership of controlling shareholders for the past five years (Stock return volatility). Demsetz and Lehn (1985) argue that the ownership structure is endogenously determined. They suggest that if shareholders or outside investors are risk-averse, then the risk inherent in the firm would have a negative (-) relationship with the ownership structure. Kang et al. (2006) find such a relationship empirically in Korean firms. The controlling shareholders tend to avoid holding ownership in higher risky companies (higher stock return volatility). However, the stock return volatility is a result of the investment and cannot precede the investment. In particular, as stock return volatility is measured based on stock returns over the past five years, this precedent relationship is even more pronounced. Based on this logic, this study employs the volatility of stock returns as an instrumental variable. We discuss the adequacy of the instrument variable with the results of the empirical analysis.
We later examine the possibility that the firm expands investment expenditures to defend against potential predation risks. We expect the potential predation risks to have a close relationship with the size of market dominance. Therefore, as a proxy of market dominance, we set a dummy variable equal to one if the firm has the largest market share11) in the industry and zero otherwise (Dominant firms).
4. Empirical Results
4.1 Descriptive statistics
<Table 1>12), presents the sample distribution based on controlling shareholders’ ownership (Controlling ownership) and the HHI. We set 10 intervals according to the size of each variable. The average controlling shareholders’ ownership is 25.03%, which is similar to that (21%) of Almeida et al. (2011). The largest number of firms is in the 0.0-0.1 of the ownership group. However, about 44.27% of firms are in the 0.2-0.5 section, and 11.43% of firms have more than 0.5 of the ownership, which implies that controlling shareholders have perfect control power. As controlling shareholders exercise their control rights not only through their direct ownership but also indirectly through affiliates, their actual influence on management activities will be greater. The results in <Table 1> clearly show the concentrated ownership structure of Korean firms, confirming the appropriateness of our assumption that the ownership structure of controlling shareholders has a significant influence on management decision-making, as they have de facto control power.
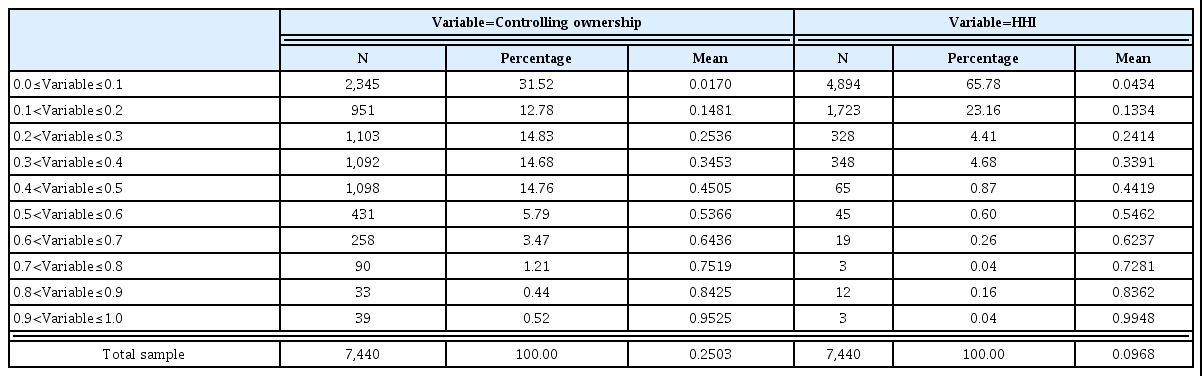
Sample Distribution based on Controlling Shareholders’ Ownership and HHI
This table presents the sample distribution based on Controlling ownership and the HHI. Controlling ownership and HHI are divided into 10 intervals, and the number of samples, the percentage of the sample, and the average value of the variable in each interval are presented. The definitions of variables are in Appendix.
The average HHI of the total sample is 0.0968. Valta (2012) reports an average HHI of about 0.062 for U.S. firms. Given the size and development stage of industries in the U.S. and Korea, it can be interpreted that product market competition in Korea reached a fairly high level. Approximately 65.78% of the total sample is in an industry with an HHI of less than 0.1. Because a low HHI industry indicates a large number of firms in the industry, the low HHI groups contain many samples. Generally (e.g., U.S. horizontal merger guidelines), industries with HHIs below 0.1 are regarded as competitive markets; however, there will be differences in management decisions according to the level of competition, even within this group. Of the sample, 11.06% of firms are in concentrated markets (HHIs greater than 0.2).
<Table 2> presents the descriptive statistics and correlation for the variables. Panel A shows the descriptive statistics. We categorize the sample into two groups: firms with residuals of equation (1) greater than 0 are overinvestment firms, and those with residuals less than 0 are underinvestment firms. We test the difference in the variables between the two groups based on the t-test and Wilcoxon ranked sum test.
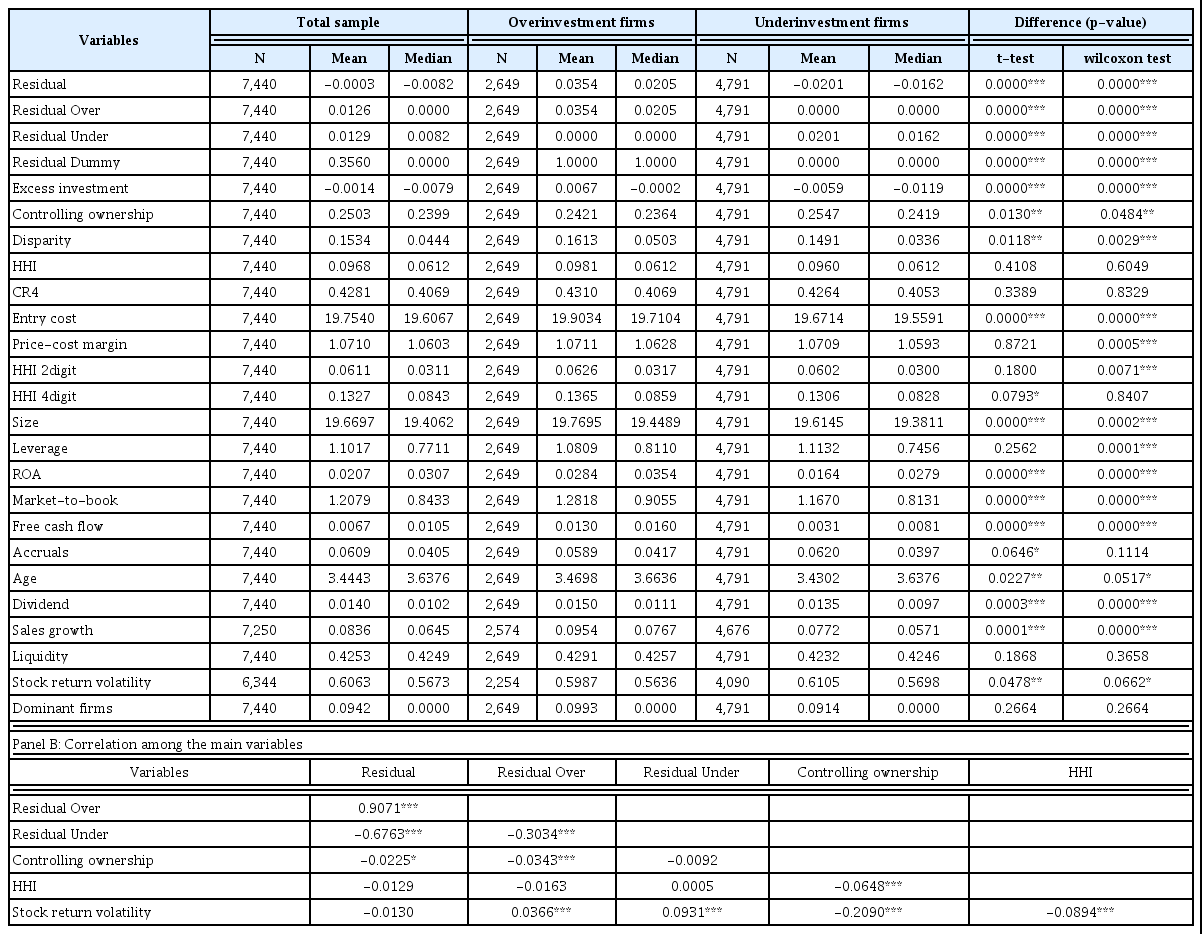
Descriptive Statistics and Correlations
This table presents the descriptive statistics and correlations for the variables used in the empirical analysis. Panel A shows the mean and median value of each variable in the total sample, overinvestment firms sample, and underinvestment firms sample. The overinvestment firms indicate that the Residual is over zero and the underinvestment firms indicate that the Residual is less than or equal to zero. The results of the difference tests between the overinvestment and underinvestment samples are presented in the last two columns. Panel B shows the correlations among the main variables. The definitions of the variables are in Appendix. ***, **, and * denote significance at the 1%, 5%, and 10% level, respectively.
Panel A: Descriptive statistics
The average Residual, a measure of investment inefficiency, is -0.0003.13) The average Residual Over and Residual Under are 0.0126 and 0.0129, respectively. The higher average of Residual Under than that of Residual Over reflects the passive investment expenditure of Korean firms, as Korea’s economic growth is low. However, the average Residual Over of the group of overinvestment firms, 0.0354, is greater than the average Residual Under of the group of underinvestment firms, 0.0201. This result suggests that the amount of overinvestment is larger than the amount of underinvestment.
The average of Controlling ownership is 0.2503 and is smaller for overinvestment firms than for underinvestment firms. The difference is significant at the 5% level. This result is consistent with the theory. The average disparity between ownership and control (Disparity) is 0.1534, implying that controlling shareholders can exercise 15.34% of control rights without direct ownership.
The average HHI, the measure of product market competition, is 0.0968. The average for the alternative measures of product market competition, CR4, Entry cost, and Price-cost margin are 0.4281, 19.7540, and 1.0710, respectively. Similar to the HHI, the values are higher for overinvestment firms. The average HHI 2digit and HHI 4digit are 0.0611 and 0.1327, respectively.
Panel B presents the correlation among main variables. There is a significantly negative (-) correlation between Residual and Controllership ownership. However, Controlling ownership is closely related to overinvestment (Residual Over) and does not show a significant correlation with underinvestment (Residual Under). This result supports Hypothesis 1-1. The correlation coefficient between Residual and HHI is not significant. The correlation coefficient between Stock return volatility and Residual (-0.0130) is insignificant, while that between Stock return volatility and Controlling ownership (-0.2090) is significant at the 1% level, suggesting that Stock return volatility is economically and statistically appropriate as an instrument variable.
4.2 Main Results
4.2.1 Regression results
We examine the effect of the controlling shareholders’ ownership and product market competition on investment inefficiency using ordinary least squares (OLS) regressions. Considering the time-lag between the investment decision and independent variables, we adopt the values for all independent variables one period (t-1) before. Since our sample consists of panel data, errors due to the time-series correlation and heteroscedasticity may arise. Petersen (2009) suggests that using the firm-level clustered standard error can reduce such errors considerably. Therefore, we test our hypotheses using OLS regressions with a clustered standard error at the firm-level. To control for the year and industry effects to reduce the potential endogeneity, we include the year (Year effect, η) and industry dummies (Industry effect, λ) in the model. Equation (2) represents the main empirical model, and we provide the definitions of each variable in <Appendix>.
To examine the effect of controlling shareholder’s ownership according to the level of product market competition, we set three dummy variables based on the tertile of competition. High is a dummy variable that takes the value of one when the competition measure is in the highest tertile (non-competitive product markets), Median is a dummy variable that takes the value of one when the competition measure is in the median tertile, and Low is a dummy variable that takes the value of one when the competition measure is in the lowest tertile (competitive product markets). Using the interaction variables between these dummy variables and controlling shareholder’s ownership, we analyze how the effect of controlling shareholder’s ownership changes depending on the level of competition, following Giroud and Mueller (2011). As <Table 1> shows, the division based on the tertile of competition is generally similar to the classification of the monopoly regulation,14) so we expect that the analysis will reflect the reality.
<Table 3> presents the results of the regression analysis. Model (1)15) is the result of verifying the effect of controlling shareholder’s ownership on investment inefficiency. The coefficient of Controlling ownership is significantly negative (-) at the 5% level. This result implies that, as discussed theoretically, controlling shareholders with low ownership tend to overinvest to maximize their private benefits (Hypothesis 1-1). On the other hand, controlling shareholders with large ownership tend to underinvest as they are more risk-averse (Hypothesis 1-2).

Effect of Controlling Shareholders’ Ownership and Product Market Competition on Investment Inefficiency
This table presents the effect of the controlling shareholders’ ownership and product market competition on investment inefficiency using OLS regressions. The dependent variable is Residual in models (1)-(4) and Excess investment in models (5) and (6). Models (1), (2), (5), and (6) show the result for the total sample. Model (3) is the result using the sample of firms in the upper 33% of HHI, and Model (4) is the result using the sample of firms in the lower 33% of HHI. To remove outliers, each variable is winsorized at the 1% and 99% levels. The definitions of variables are in Appendix. The numbers in square brackets are z-statistics computed by standard errors clustered at the firm level. ***, **, and * denote significance at the 1%, 5%, and 10% level, respectively.
Model (2) is the analysis of whether the influence of the controlling shareholder’s ownership on investment inefficiency changes according to product market competition. The coefficient of the interaction variable between Controlling ownership and High has a statistically negative (-) value, suggesting that controlling shareholders change investment expenditures to pursue private benefits only in non-competitive product markets. Notably, the magnitude and statistical significance of the coefficient of the interaction variable is larger and more significant than is the coefficient of Controlling ownership in model (1). Thus, our results for the overall sample are mainly driven by the behavior in non-competitive product markets. The interaction variables between Controlling ownership, and Median and Low are not statistically significant, implying that controlling shareholders do not change investment expenditures according to their ownership due to the disciplinary effect of competitive threats. The coefficient of HHI is insignificant, meaning that we find a moderating effect of the controlling shareholders on management decisions, rather than a direct effect of competition. The above results support Hypothesis 2-1.
Among the control variables, the debt-to-equity ratio (Leverage) has a significant negative (-) effect, which we can interpret as an increase in interest costs and a relatively high risk of bankruptcy, making aggressive investment difficult. The market-to-book ratio (Market-to-book), which is a substitute for growth opportunities, has a positive (+) coefficient, as firms with relatively high growth opportunities actively expand investment spending. Free cash flow also has a positive (+) impact because firms with high internal funding capacity can cover the cost of investment. The age of the firm (Age) has a positive (+) coefficient, as older firms have low information asymmetry and can secure external financing. Liquidity has a positive (+) effect because firms with a large number of assets to use in the short term can actively invest.
We test the hypotheses empirically using interaction variables, but we can also use a separated sample approach. The separated sample approach assumes that there is a difference in the effect of all independent variables between different samples, while the interaction variables approach assumes that there is a difference only in the effect of controlling shareholders’ ownership. Model (3) shows the effect of controlling shareholders’ ownership on the investment inefficiency in firms in non-competitive product markets (HHI upper 33%, High), and model (4) shows the result of the sample of firms in competitive product markets (HHI lower 33%, Low). The coefficient of Controlling ownership in model (3) has a significantly negative (-) value at the 5% level, while the significance in model (4) disappears.
Models (5) and (6) show the results of the same analysis as in models (1) and (2), but using industry-adjusted investment expenditures (Excess investment) as the dependent variable. The coefficient of the controlling shareholders’ ownership in model (5) is negative (-), but not significant. The interaction variables between Controlling ownership, and Median and Low are not significant. The results have the same interpretation as in the results of model (2).
4.2.2 Overinvestment Versus Underinvestment
We further analyze investment inefficiency by examining overinvestment and underinvestment separately for a more rigorous examination of the path of the agency problems. Models (1) and (2) in <Table 4> focus on the overinvestment problem. The dependent variable is Residual Over. In model (1), the coefficient of Controlling ownership is significantly negative (-) at the 1% level. In model (2), the interaction variable between Controlling ownership and High is significant and negative (-), but that between Controlling ownership and Median and Low is insignificant. Models (3) and (4) focus on the underinvestment problem, and the dependent variable is Residual Under. The coefficient of Controlling ownership in model (3), as well as the coefficients of the interaction variables in model (4), are insignificant. These results imply that the results in <Table 3> are mainly due to the overinvestment problem. That is, the main path by which controlling shareholders pursue private benefits is overinvestment based on low ownership. The disciplinary effect of competitive threats affects this overinvestment behavior.

Overinvestment Versus Underinvestment
This table presents the effect of controlling shareholders’ ownership and product market competition on overinvestment and underinvestment. The dependent variable is Residual Over in models (1) and (2), Residual Under in models (3) and (4), and Residual Dummy in models (5) and (6). Models (1)-(4) use OLS regressions and models (5) and (6) use a Probit model. To remove outliers, each variable is winsorized at the 1% and 99% levels. The definitions of variables are in Appendix. The numbers in square brackets are z-statistics computed by standard errors clustered at the firm level. ***, **, and * denote significance at the 1%, 5%, and 10% level, respectively.
Models (5) and (6) present the result of the probit model using Residual Dummy as a dependent variable to examine whether the incentive for overinvestment or underinvestment is more related to the controlling shareholders’ ownership and product market competition. The Residual Dummy is a dummy variable that takes the value of one if a firm is an overinvestment firm. This approach focuses on the probability of over- or underinvestment rather than their scales. It compares the tendencies to overinvest or underinvest and alleviates the concern about overestimation due to the scale of over- or underinvestment. In model (5), the coefficient of Controlling ownership is significant and negative (-), which suggests that controlling shareholders with low ownership tend to overinvest. In model (6), the coefficient of the interaction variable between Controlling ownership and High is significantly negative (-), implying that we mainly observe the overinvestment tendency found in model (5) in non-competitive industries.
4.3 Robustness check
4.3.1. Alternative Model Specifications
<Table 5> presents the result of a robustness check using alternative model specifications. Panel A shows the results of the regression analysis proposed by Fama and MacBeth (1973). After deriving the coefficients from the regression analysis based on the cross-sectional data for each fiscal year, we calculate the average of the coefficients and verify the statistical significance. We thus reduce the limitation of the OLS regression due to cross-sectional correlation considerably. Models (1) and (2) are the results of this cross-sectional regression using Residual as a dependent variable. Similar to the main result, the coefficient of Controlling ownership is significantly negative (-) in model (1), and only the coefficient of the interaction variable between Controlling ownership and High is significant and negative (-) among the interaction variables in model (2). This result is the same as that in <Table 3>. Models (3) and (4) use the Residual Over and models (5) and (6) use the Residual Under as the dependent variable, respectively. The results of models (1) and (2) are consistent with those in models (3) and (4), reaffirming that controlling shareholders’ pursuit of private benefits based on their ownership is mainly related to overinvestment.
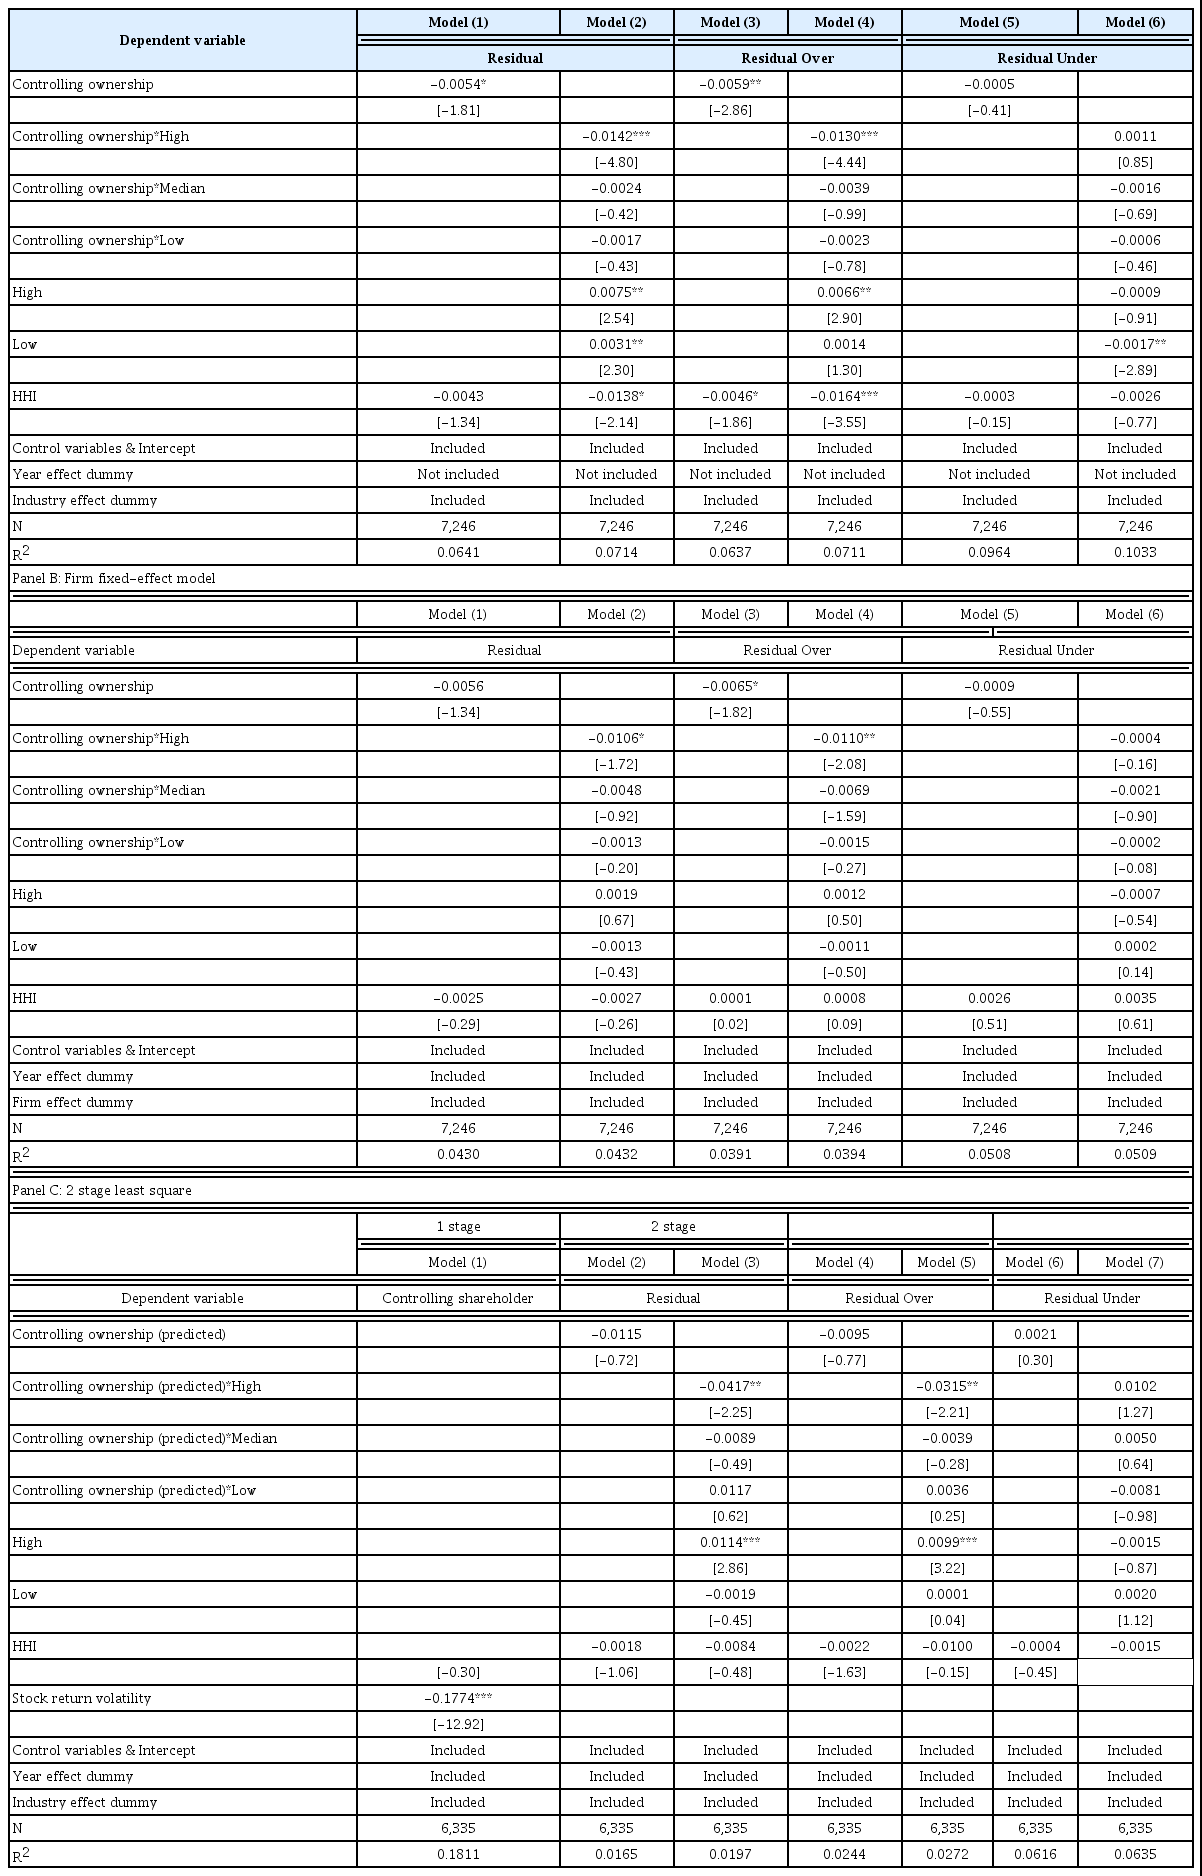
Robustness Check 1: Alternative Model Specifications
This table presents the results for the effects of controlling shareholders’ ownership and product market competition on investment inefficiency through alternative model specifications. Panel A shows the results of the Fama and MacBeth (1973) model, Panel B shows the result of the firm fixed-effect model, and Panel C shows the result of the 2SLS model. Each panel uses three dependent variables (Residual, Residual Over, and Residual Under). To remove outliers, each variable is winsorized at the 1% and 99% levels. The definitions of the variables are in Appendix. The numbers in square brackets are t-statistics. ***, **, and * denote significance at the 1%, 5%, and 10% level, respectively.
Panel A: Fama and MacBeth (1973) cross-sectional regression
Panel B presents the results using a firm fixed-effect model. This model mitigates the endogeneity problem due to the omitted variable bias by reflecting unobservable firm characteristics in the constant term.16), In model (1), which uses Residual as a dependent variable, the coefficient of Controlling ownership is negative (-), but insignificant. However, in model (2), the coefficient of the interaction variable between Controlling ownership and High is significantly negative (-). Models (3) and (4) are the results using Residual over as a dependent variable. The results are similar to those in <Table 4>.
Lastly, panel C shows the results of the 2SLS analysis.17), The 2SLS method reduces the endogeneity problem based on reverse causality. On the potential reverse causality between investment inefficiency (Residual) and Controlling ownership, we conduct the analysis using a one-period time-lag between the two variables. Nevertheless, given the claims in prior studies that the ownership of controlling shareholders could be determined endogenously, it cannot be completely free from the endogeneity problem (Demsetz and Lehn, 1985). Model (1) presents the results of the first stage model. The coefficient of Stock return volatility is significant and negative (-). In general, the instrument variable is adequate by the rule of thumb if its t-value is 3.3 or higher. Stock return volatility fulfills the criteria, thus confirming its adequacy. Models (2) and (3) are the results using Residual as a dependent variable. The coefficient of Controlling ownership in Model (2) is not significant, but the coefficient of the interaction variable between Controlling ownership and High in Model (3) is significant. This result supports our main finding. Models (4) and (5) use Residual Over and models (6) and (7) use Residual Under as the dependent variable, respectively. Only the coefficient of the interaction variable between Controlling ownership and High in model (5) is negative (-), confirming that controlling shareholders’ pursuit of private benefits is mainly related to overinvestment.
4.3.2 Alternative Measures of Product Market Competition
<Table 6> shows the results of repeating the analyses in <Table 3> and <Table 4> using alternative measures of product market competition to reduce the potential measurement error from both the original measures of competition and the industry classification. Panel A presents the results of the analysis using three alternative measures. Models (1) - (3) use CR4, models (4) - (6) use Entry cost, and models (7) - (9) use Price-cost margin to measure the level of competition. In most models, we find a negative (-) influence of Controlling ownership on investment inefficiency mainly in non-competitive markets (High), which disappears in competitive markets (Low). In addition, investment inefficiency is mainly related to overinvestment, but not to underinvestment. These results confirm that our main results do not change with the selection of the measure of competition and are robust.

Robustness check 2: Alternative Methods of Calculating Product Market Competition
This table presents the results of the OLS regression analysis of the effects of controlling shareholders' ownership and product market competition on investment inefficiency using alternative measures of product market competition. Panel A shows the result using alternative methods to calculate product market competition. Models (1)-(3) use CR4, models (4)-(6) use Entry cost, and models (7)-(9) use Price-cost margin as an alternative measure. Panel B shows the result using different industrial classification criteria to measure the level of competition. Models (1)-(3) use the 2-digit KSIC (HHI 2digit) and models (4)-(6) use the 4-digit KSIC (HHI 4digit). Each panel uses three dependent variables (Residual, Residual Over, and Residual Under). To remove outliers, each variable is winsorized at the 1% and 99% levels. The definitions of the variables are in Appendix. The numbers in square brackets are z-statistics computed by standard errors clustered at the firm level. ***, **, and * denote significance at the 1%, 5%, and 10% level, respectively.
Panel A: different measures
Panel B presents the results using HHI calculated by applying another industry classification standard. Models (1) - (3) use the 2-digit KSIC (HHI 2digit) and models (4) - (6) use the 4-digit KSIC (HHI 4digit) to estimate HHI. The results are consistent with those in <Table 3> and <Table 4> and confirm the robustness of the main results.
4.4 Controlling Shareholders’ Incentive for Pursuing the Private Benefits
The results of the previous analyses suggest that controlling shareholders’ incentives to pursue private benefits based on their ownership can be associated with inefficient investment behavior. To examine the behavior in more detail, we use the ownership-control disparity. Since the disparity reflects purely the incentive to pursue private benefits, while ownership reflects both the incentive to the monetary compensation and pursue private benefits, we expect that this approach will alleviate the ambiguity in the interpretation of the results.
<Table 7> presents the results of examining the effect of ownership-control disparity on investment inefficiency and the change in the effect according to product market competition using Residual as a dependent variable. In model (2), the coefficient of the interaction variable between the Disparity and High has a significant and positive (+) value, while that of the other interaction variables is not significant. This result suggests that the overinvestment behavior occurs in non-competitive markets, and disappears in competitive markets. This result supports our main findings. Models (3) and (4) are the results using the separated sample approach. Similar to model (2), the results also show that controlling shareholders overinvest in non-competitive markets based on their ownership-control disparity.
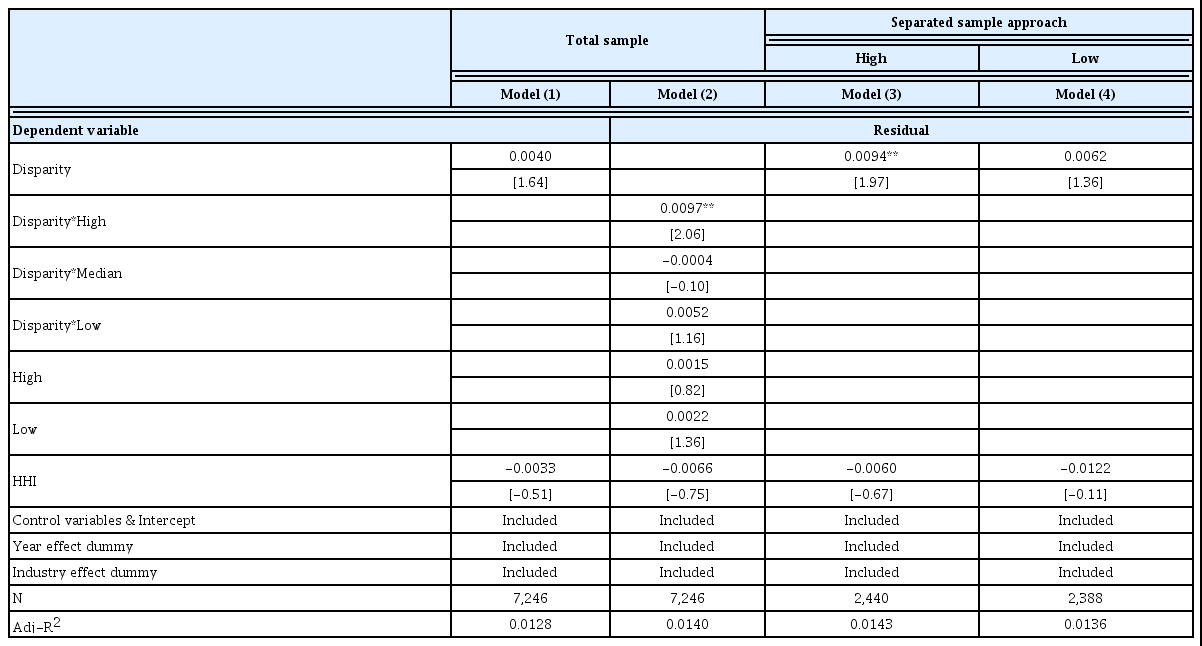
Controlling shareholders’ incentive for pursuing private benefits
This table presents the results of the OLS regression analysis of the effects of ownership-control disparity and product market competition on investment inefficiency. Models (1) and (2) show the result for the total sample. Model (3) is the result using the sample of firms in the upper 33% of HHI and Model (4) is the result using the sample of firms in the lower 33% of HHI. The dependent variable is Residual. To remove outliers, each variable is winsorized at the 1% and 99% levels. The definitions of the variables are in Appendix. The numbers in square brackets are z-statistics computed by standard errors clustered at the firm level. ***, **, and * denote significance at the 1%, 5%, and 10% level, respectively.
4.5 Alternative Explanations: Predation Risk Versus the Agency Problem
We interpret our results from the perspective of the agency problem. However, other arguments may arise. Excessive investment spending can be viewed as a defense against potential predatory risk. Non-competitive product markets offer firms relatively stable profitability, so many firms will prefer to enter these industries. Firms in these industries are more likely to have exposure to predation risks (Bolton and Scharfstein, 1990). Therefore, we can interpret the fact that the controlling shareholder makes excessive investment expenditures in non-competitive markets as a behavior to defend against potential predatory risk by securing a competitive advantage. Intuitively, predatory risk should increase for firms that lack market power. Firms with market power can effectively defend against potential predatory risks based on their market position and economic efficiency (e.g. economies of scale and scope), while those without market power will face predatory risk. If our results are mainly observed in firms with relatively low market power, it raises the possibility of weighting the interpretation toward predation risk. To measure market power, we use whether a firm is a dominant firm in its industry or not (Dominant firms).
Panel A of <Table 8> presents the results after dividing the whole sample into market-dominant firms (those with the largest market share in an industry, models (1) and (2)) and other firms (models (3) and (4)). In both models (2) and (4), the coefficients of the interaction variables between Controlling ownership and High have significantly negative (-) values, while those of other interaction variables are not significant. This result indicates no difference from our main results after dividing the sample based on market power. Rather, the result clarifies that there is no room for interpretation based on predatory risk, as the magnitude and statistical significance of the coefficient of the interaction variable between Controlling ownership and High are greater in the sample of dominant firms.

Testing Alternative Explanation: Predation Risk Versus Agency Problem
This table presents the results of the OLS regression analysis of the effects of controlling shareholders' ownership and product market competition on investment inefficiency using the separated sample approach. Panel A shows the result of the separated sample based on whether the firm is a dominant firm (Dominant firms). Panel B shows the result of the separated sample based on the median of discretionary accruals (Accruals). The dependent variable is Residual. To remove outliers, each variable is winsorized at the 1% and 99% levels. The definitions of the variables are in Appendix. The numbers in square brackets are z-statistics computed by standard errors clustered at the firm level. ***, **, and * denote significance at the 1%, 5%, and 10% level, respectively.
Panel A: Market dominance
We additionally examine the relevance of agency problems to ensure the clarity of the interpretation. If main results are strongly observed in firms with a high probability of agency problems, we can reaffirm the appropriateness of our interpretation. For this analysis, we separate the whole sample into two groups based on the median of discretionary accruals (Accruals) as a proxy for the agency problem. Panel B presents the results of the main analysis in two separate samples. Models (1) and (2) present the results using firms with larger discretionary accruals; that is, with a high probability of agency problems, and models (3) and (4) present the results using firms with smaller discretionary accruals; that is, with a low probability of agency problems. Our main results are observed only in the sample with a high probability of agency problems.
5. Conclusion
In emerging economies with relatively less developed capital markets, several studies show inefficient resource allocation (i.e., inefficient investment decision) and point out that the main reason is the existence of controlling shareholders. Nevertheless, controlling shareholders still exercise excessive control in the reality. This suggests that there may be another factor that we must consider to validate the agency theory in emerging economies; in this study, we focus on product market competition.
Our empirical results show that the controlling shareholders’ ownership has a negative (-) impact on investment inefficiency. However, this effect disappears in competitive product markets and is observed only in non-competitive product markets. We can interpret this result that the competitive threat controls the incentive for controlling shareholders to pursue private benefits in advance. We also separate investment inefficiency into overinvestment and underinvestment for more rigorous analysis and find that the main result is observed only to overinvestment. In addition, we find the above results mainly in the sample of market-dominant firms and in the sample of firms with a higher probability of agency problems, meaning that the interpretation based on agency theory is more appropriate than the interpretation based on predation risk.
Our results illustrate an aspect of agency problems observed in emerging countries and suggest the disciplinary effect of product market competition. We note that the entry and price regulations in a specific industry may not only have a primary effect of restricting competition but also act as a factor to increase the agency problem. Therefore, we suggest that along with improving internal governance structures, building competitive industry structures in advance can contribute to leading efficient investment of firms in emerging economies. On the other hand, from the academic point of view, our results can help increase the possibility of generalizing agency theory by presenting interactions between internal and external control mechanisms.
References
Notes
Controlling shareholders expand their control rights using ownership by relatives or affiliates. Based on their control rights, they have active involvement in the important managerial decision-making process, such as CEO appointments and the formation of an internal governance structure. Therefore, despite the presence of a professional CEO recruited externally, controlling shareholders frequently have the final decision authority (La Porta et al., 1999; Johnson et al., 2000). In many cases, controlling shareholders participate in management as a CEO or Chairperson of the board of directors (Claessens et al., 2000).
Amihud and Lev (1981) argue that managers with low ownership can make conservative management decisions to minimize undiversifiable employment risks. However, unlike managers, controlling shareholders do not face employment risks because they have de facto control power based on direct and indirect ownership. Therefore, it is very unlikely that their argument applies to Korean firms.
Controlling shareholders possibly engage in active risk-taking to enhance the value of the shares they own (Coles et al., 2006). However, they could maximize their utility from not only the monetary compensation proportional to the ownership, but also from the private benefits through control rights. Considering these two factors together, maintaining stable management rights by avoiding the potential losses associated with risk-seeking would be the optimal choice.
We also use the market-to-book ratio to measure investment inefficiency to check the robustness, and obtain a consistent result.
Some previous studies use the absolute value of the residual as a measure of investment inefficiency without distinguishing between over- and underinvestment. However, taking the absolute value is not appropriate in this study as we distinguish between the two private benefit-seeking behaviors.
Prior studies illustrate the cash flow rights considering the ownership chain (Almeida et al., 2011). However, we are unable to use this data in this study as our sample contains all listed firms. We estimate the cash flow rights based on the ownership information of all of the affiliates in the business groups, but obtaining information for unlisted firms is difficult. As the Korea Fair Trade Commission provides the intra-group shareholding matrix, previous studies use this information for chaebol firms. By limiting only the chaebol sample, we can use the ownership variable suggested by Almeida et al. (2011). However, this approach is not suitable for analyzing the discussion of this study because it is difficult to sufficiently reflect the difference in the level of competition. If chaebol companies are mainly distributed in less competitive markets, an analysis using only chaebols will be difficult to reflect management behavior in more competitive markets.
In this study, cash flow rights refer to the ownership of controlling shareholders and their relatives, and control rights refer to the sum of cash flow rights and the ownership of affiliates. Since the controlling shareholder is the de facto owner-manager, cash flow rights are called direct ownership. On the other hand, since ownership of affiliates is an indirect means of exercising voting rights by controlling shareholders, it is called indirect ownership.
In a few cases, only the 3-digit industrial code is provided for diversified firms. For these firms, we use the HHI based on the 3-digit KSIC in the analysis using HHI based on the 4-digit KSIC. This will more realistically reflect the level of competition that each firm faces.
The number of industries based on the 3-, 2-, and 4-digit KSIC is 268, 74, and 663, respectively.
The number of firm-year observations used to measure the HHI is 265,396.
We can measure market dominance by market share, though determining whether a firm has market dominance based on a certain level of market share will have a limitation in that that firms in a specific market (e.g., a non-competitive industry) are mostly regarded as market-dominant operators.
In an unreported result, as the threat of competition increases, the controlling shareholders’ ownership decreases. The difference between the ownership of controlling shareholders in the sample with HHI in the bottom 10% and the sample with HHI in the top 10% is about 6.85%.
The average Residual does not have a value of 0 because the sample we use to estimate investment inefficiency consists of 12,982 firm-year observations (all listed firms), while the sample we use to verify the hypothesis is limited to the firms whose controlling shareholders’ ownership and the level of product market competition is available. To prevent errors caused by this setting, we also test the hypotheses using the same sample as we use to estimate investment inefficiency and obtain consistent results.
U.S. horizontal merger guidelines classify non-intrusive markets as having HHIs below 0.1, fair markets as between 0.1 and 0.18, and centralized markets as above 0.18.
Bena and Xu (2017), Byun et al. (2018) assert that there is a causal relationship between the ownership structure of controlling shareholders and competition. Given these arguments, we need to check the possibility of the multicollinearity problem based on correlations between independent variables. In our baseline model, the variance inflation factor is 3.80. As the statistic is less than 10 (rule of thumb), there are no statistical problems with multicollinearity.
We do not use this methodology in the main analysis model because the dummy variables based on the competition level do not change much in a time series, which may cause the problem of multi-collinearity with firm fixed-effects.
We conducted the Dubin test and the Wu-Hausman test to verify the exogeneity of the instrumental variable. As a result, the null hypothesis that there is no endogeneity was not rejected (p-value=0.7631 (Durbin) / 0.7638 (Wu-Hausman)). In other words, it is difficult to judge Controlling ownership as an endogenous variable. Nevertheless, since endogeneity is intuitively suspected, 2SLS analysis was additionally performed.
Appendix

Definitions of the Variables